Welcome to STA 221!
January 08, 2026
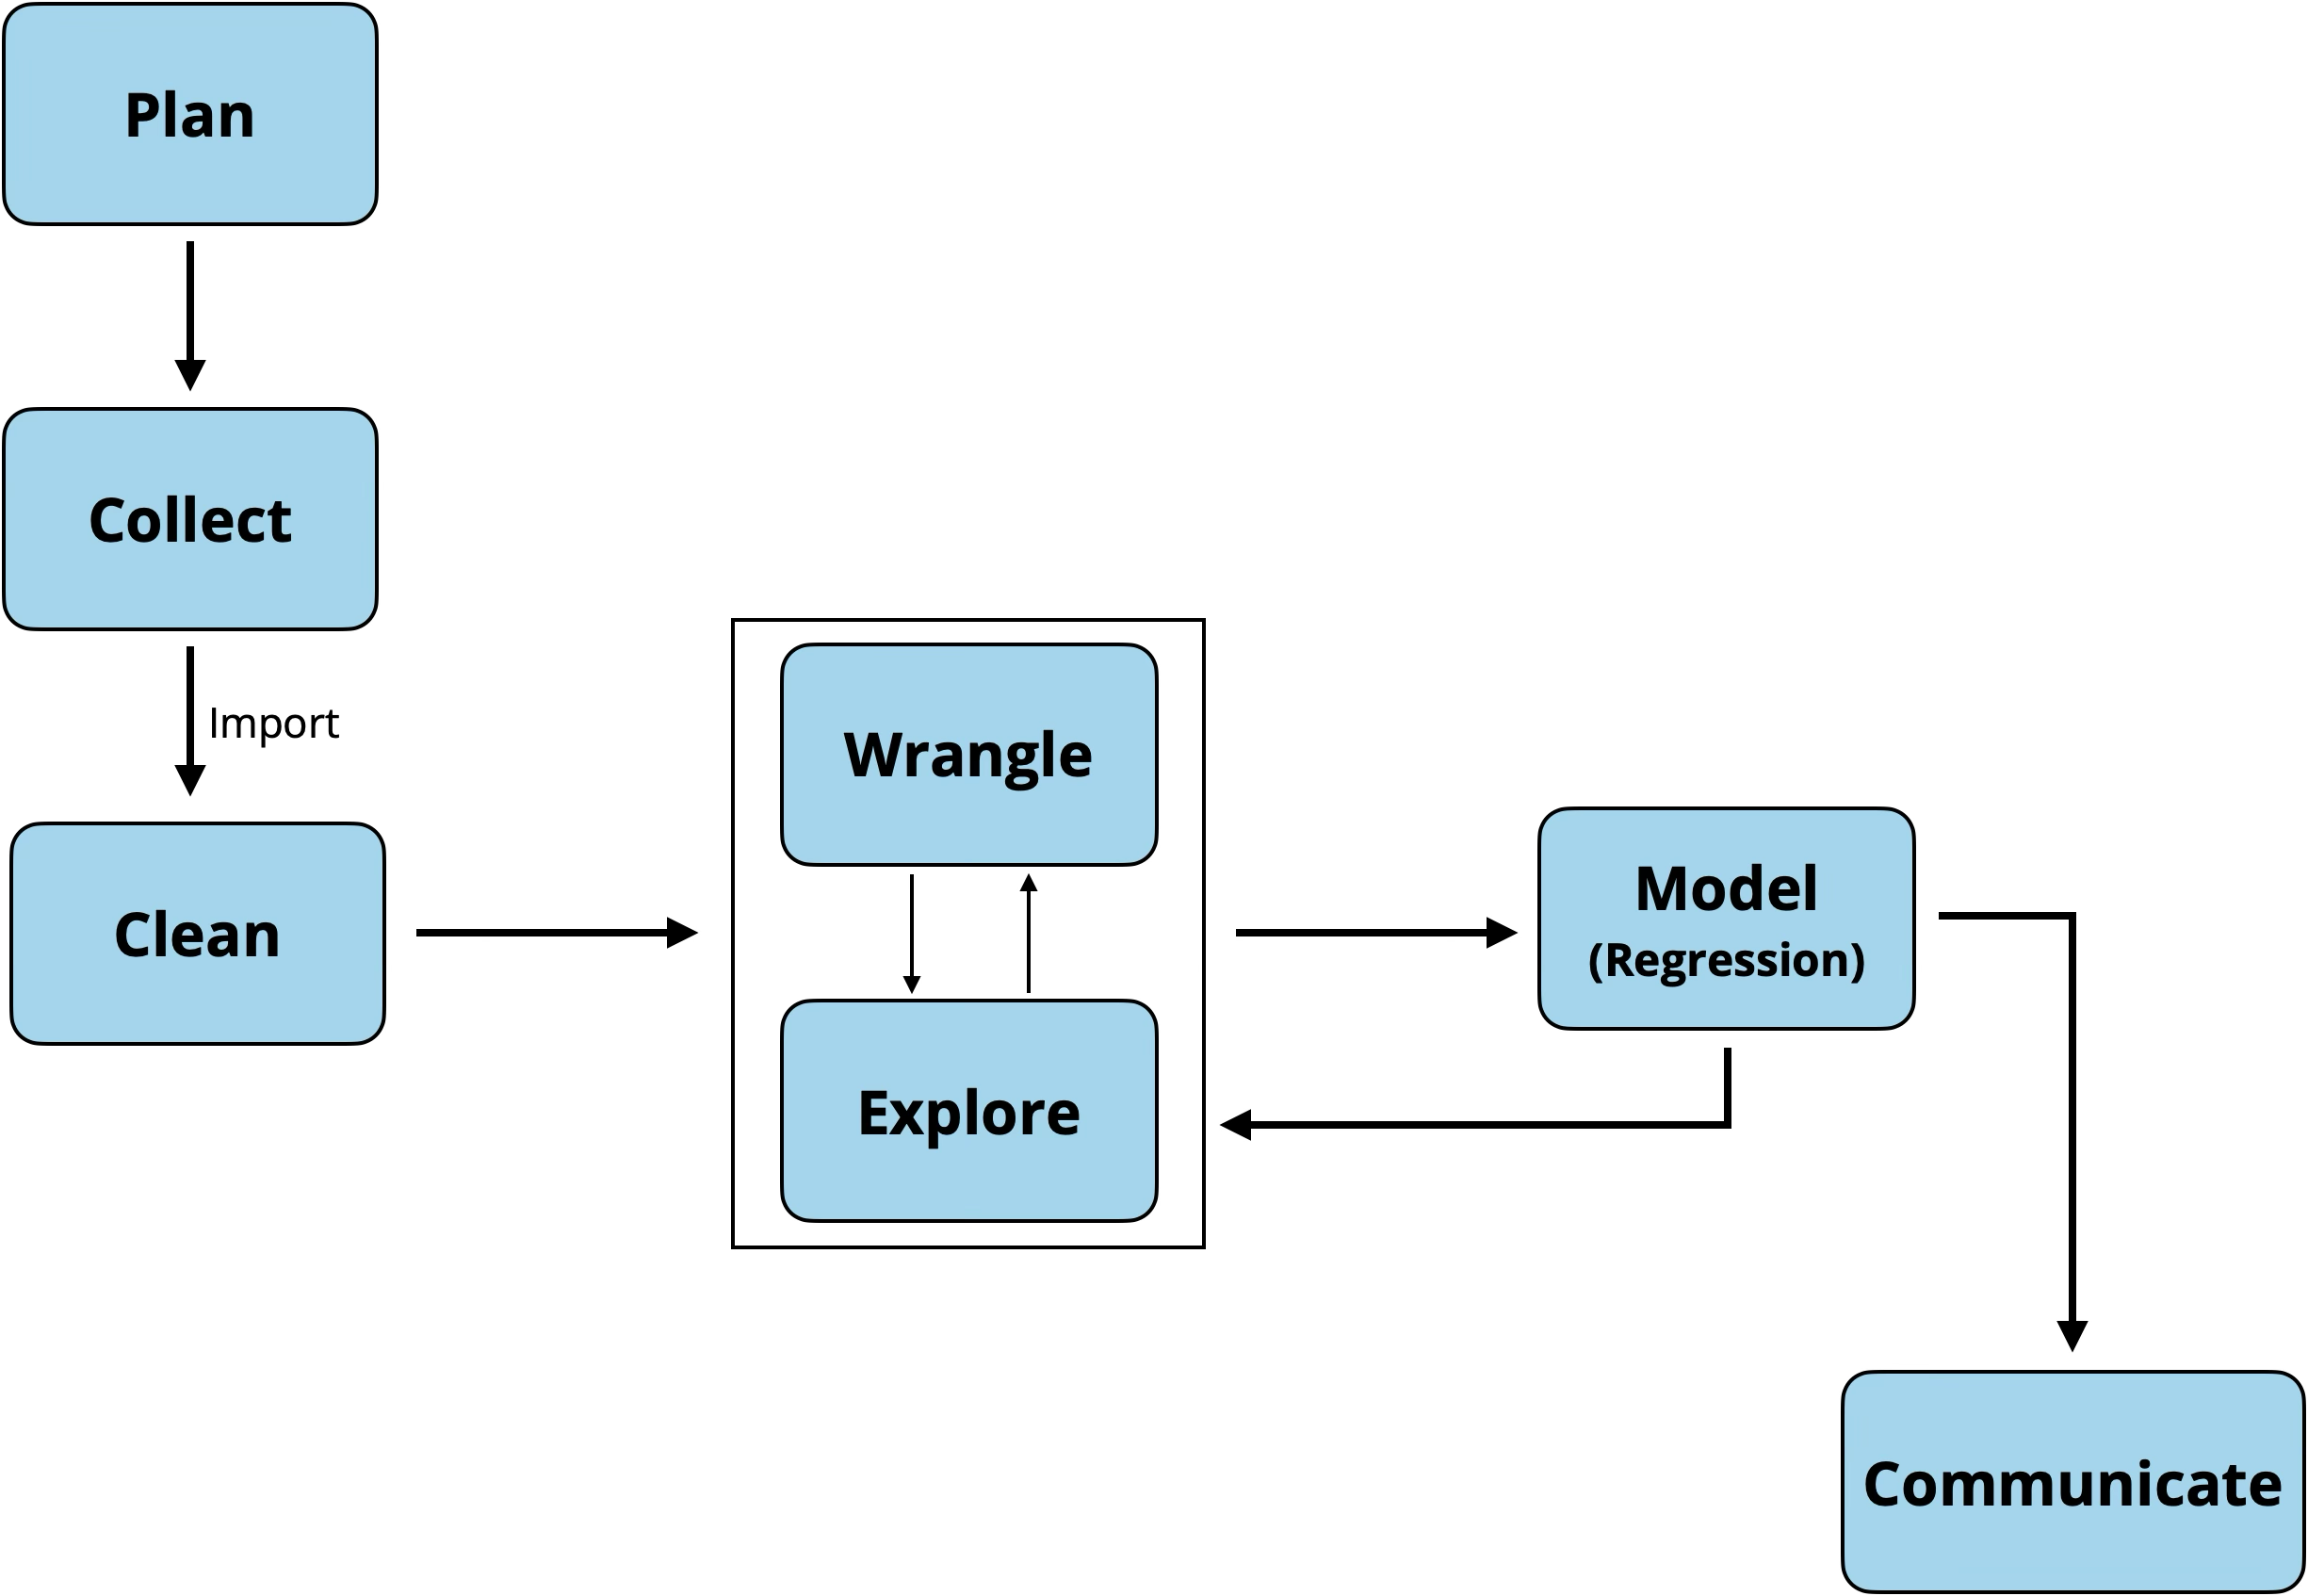
Data science workflow
Linear regression in practice
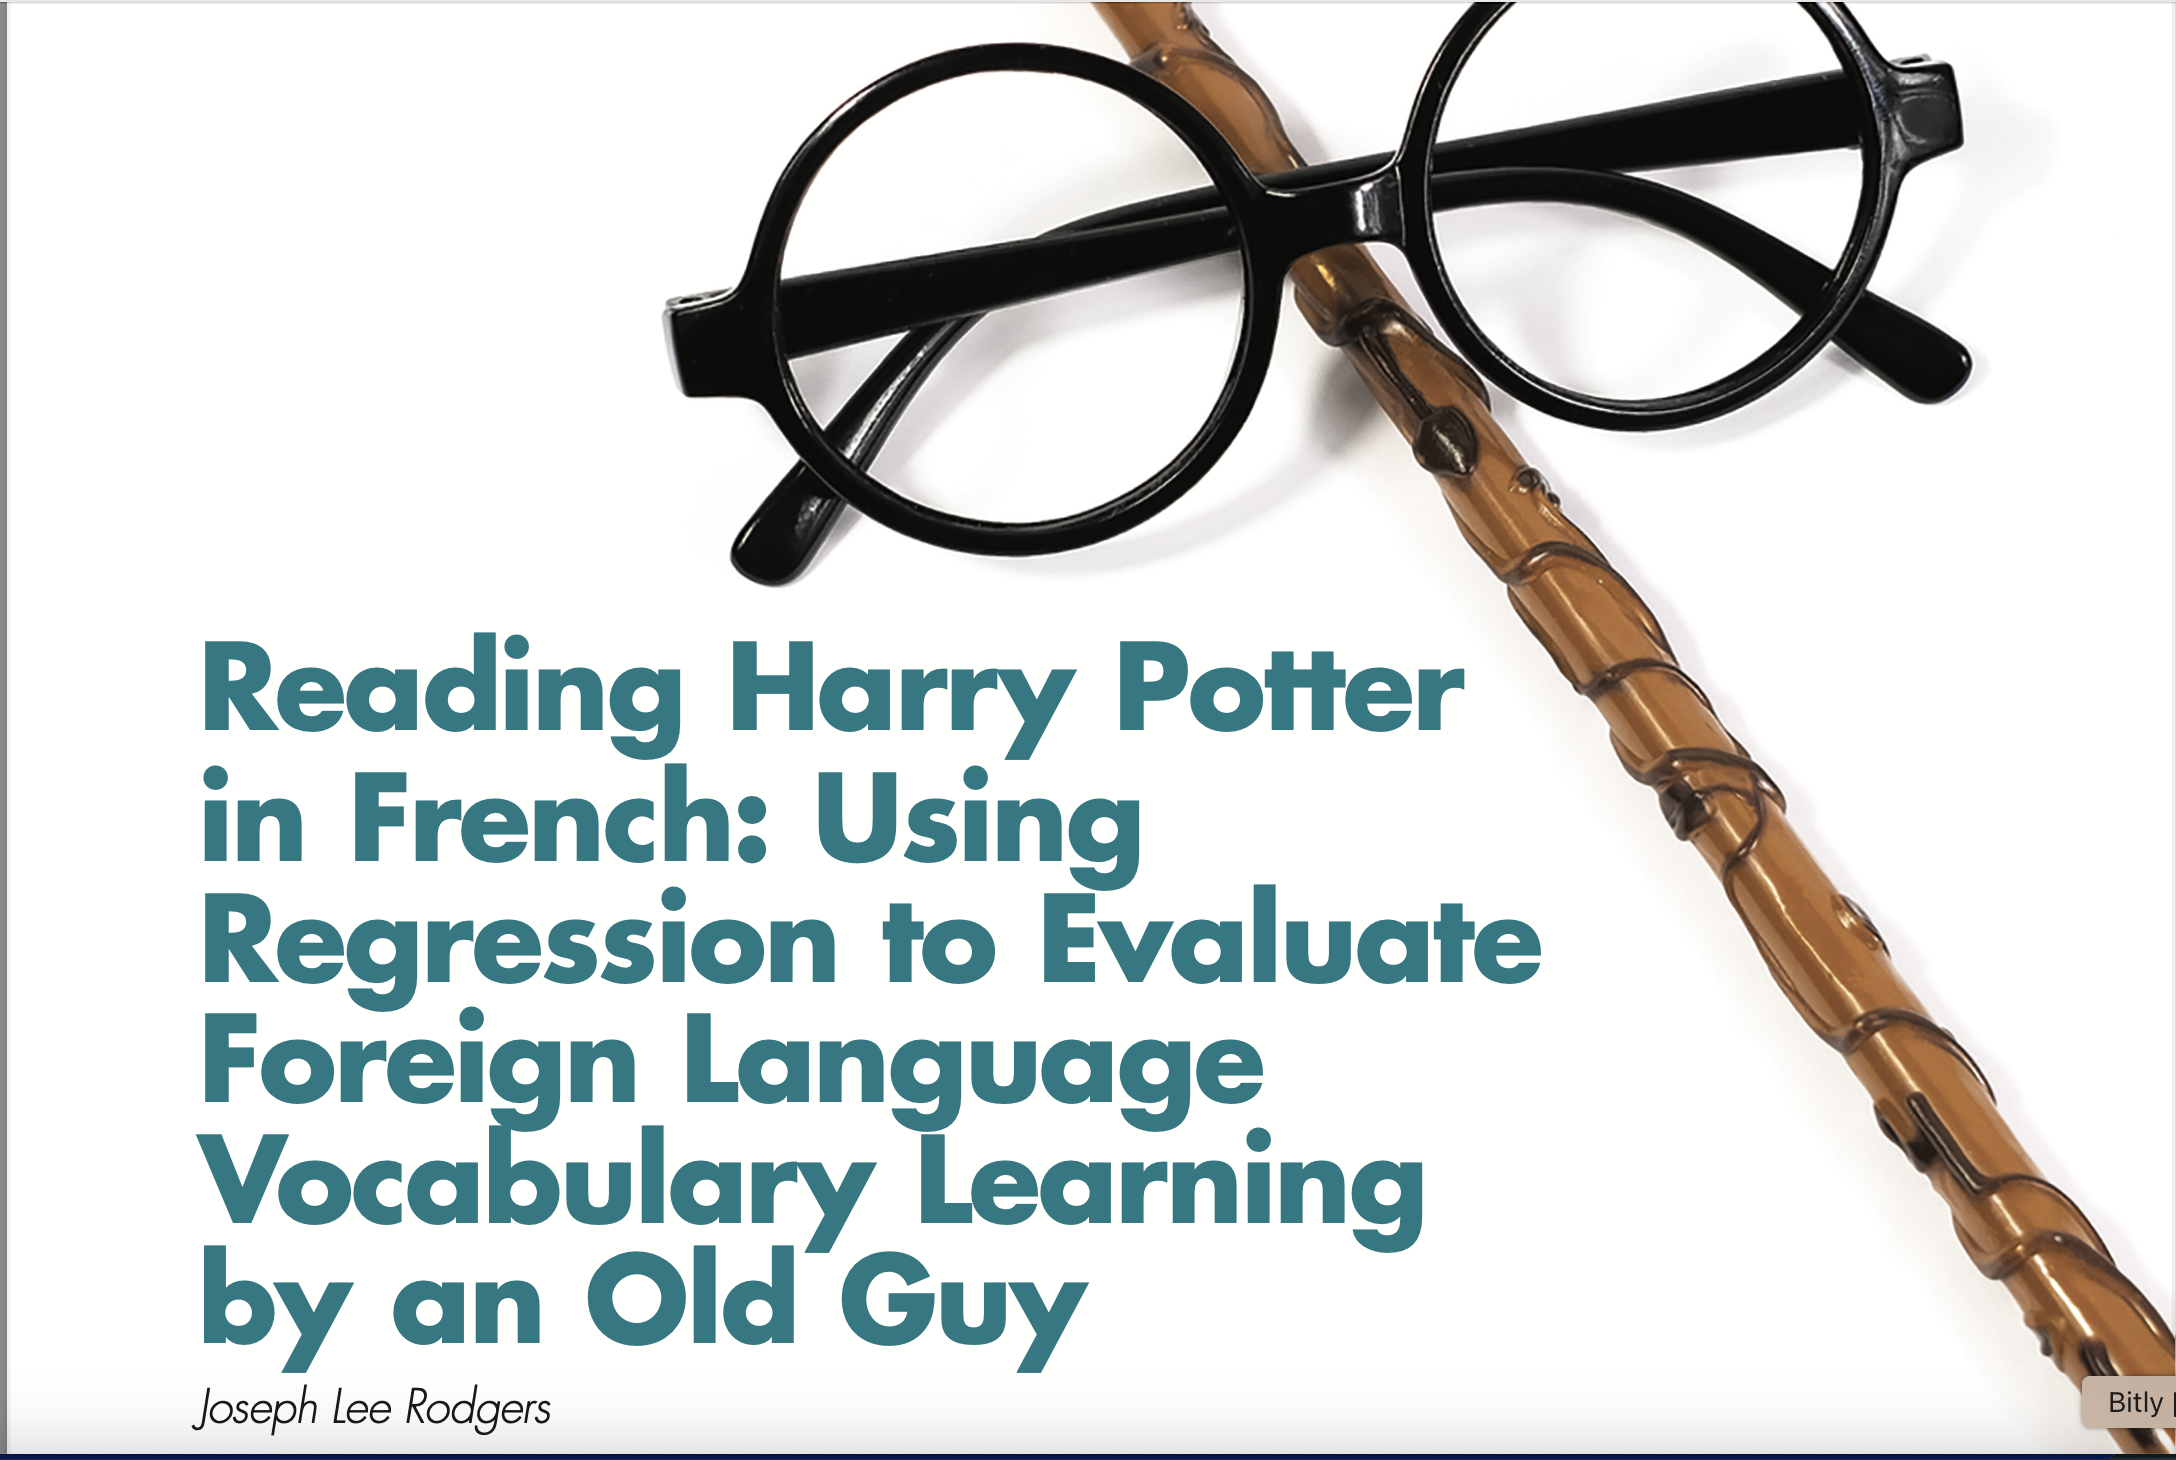
Example: Reading Harry Potter
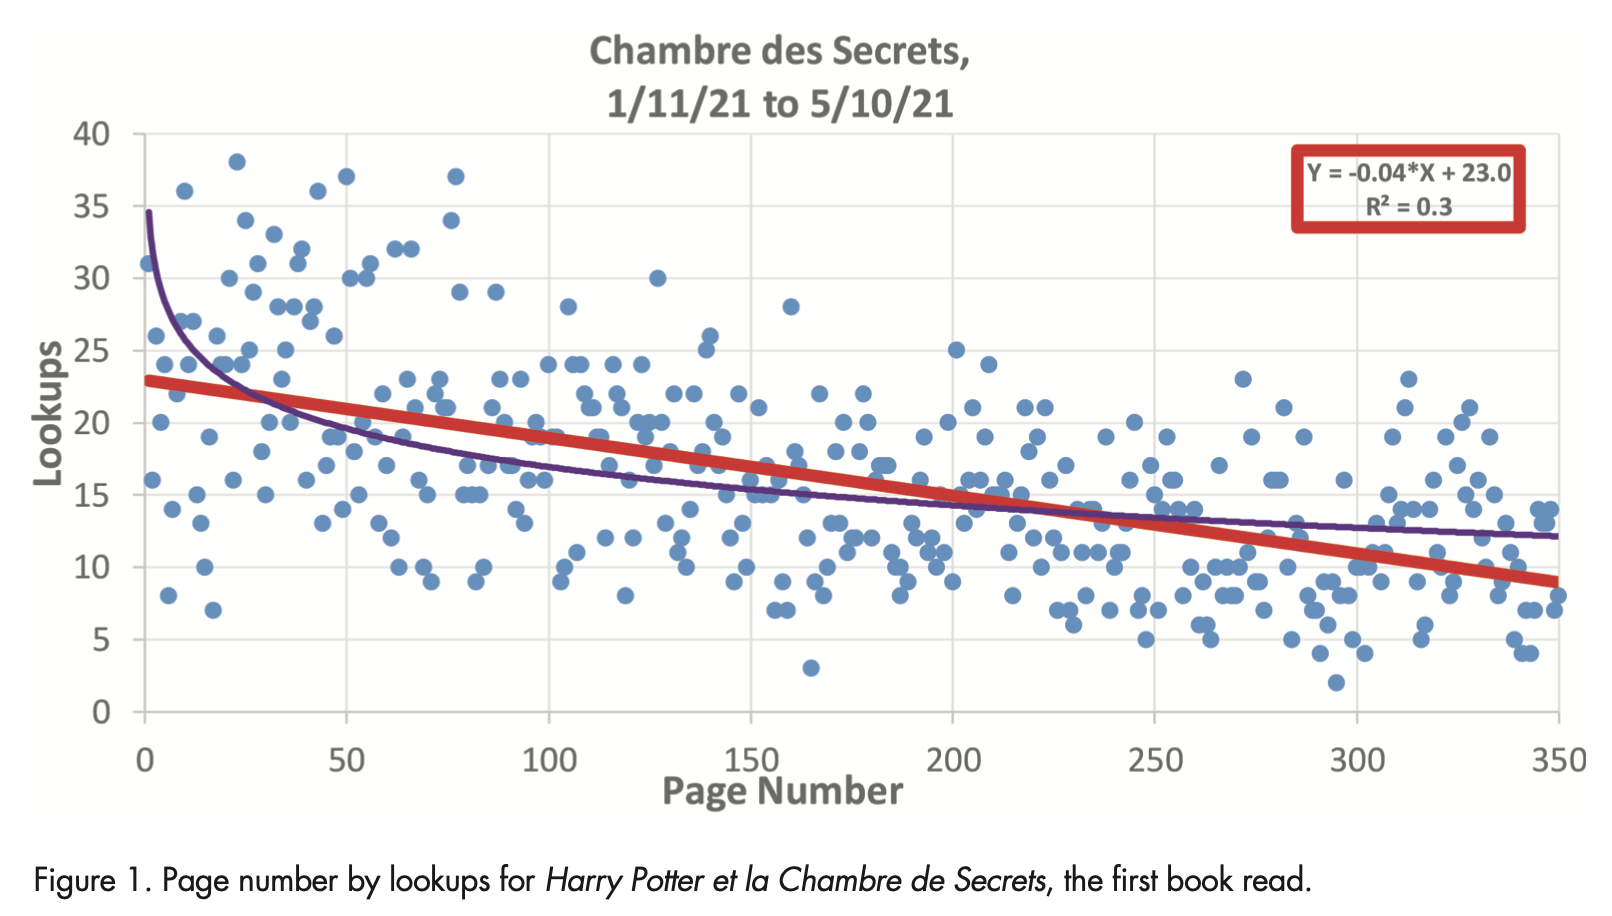
\[ \text{Lookups} = 23.0 - 0.04 \times \text{Page Number} \]
Logistic regression in practice
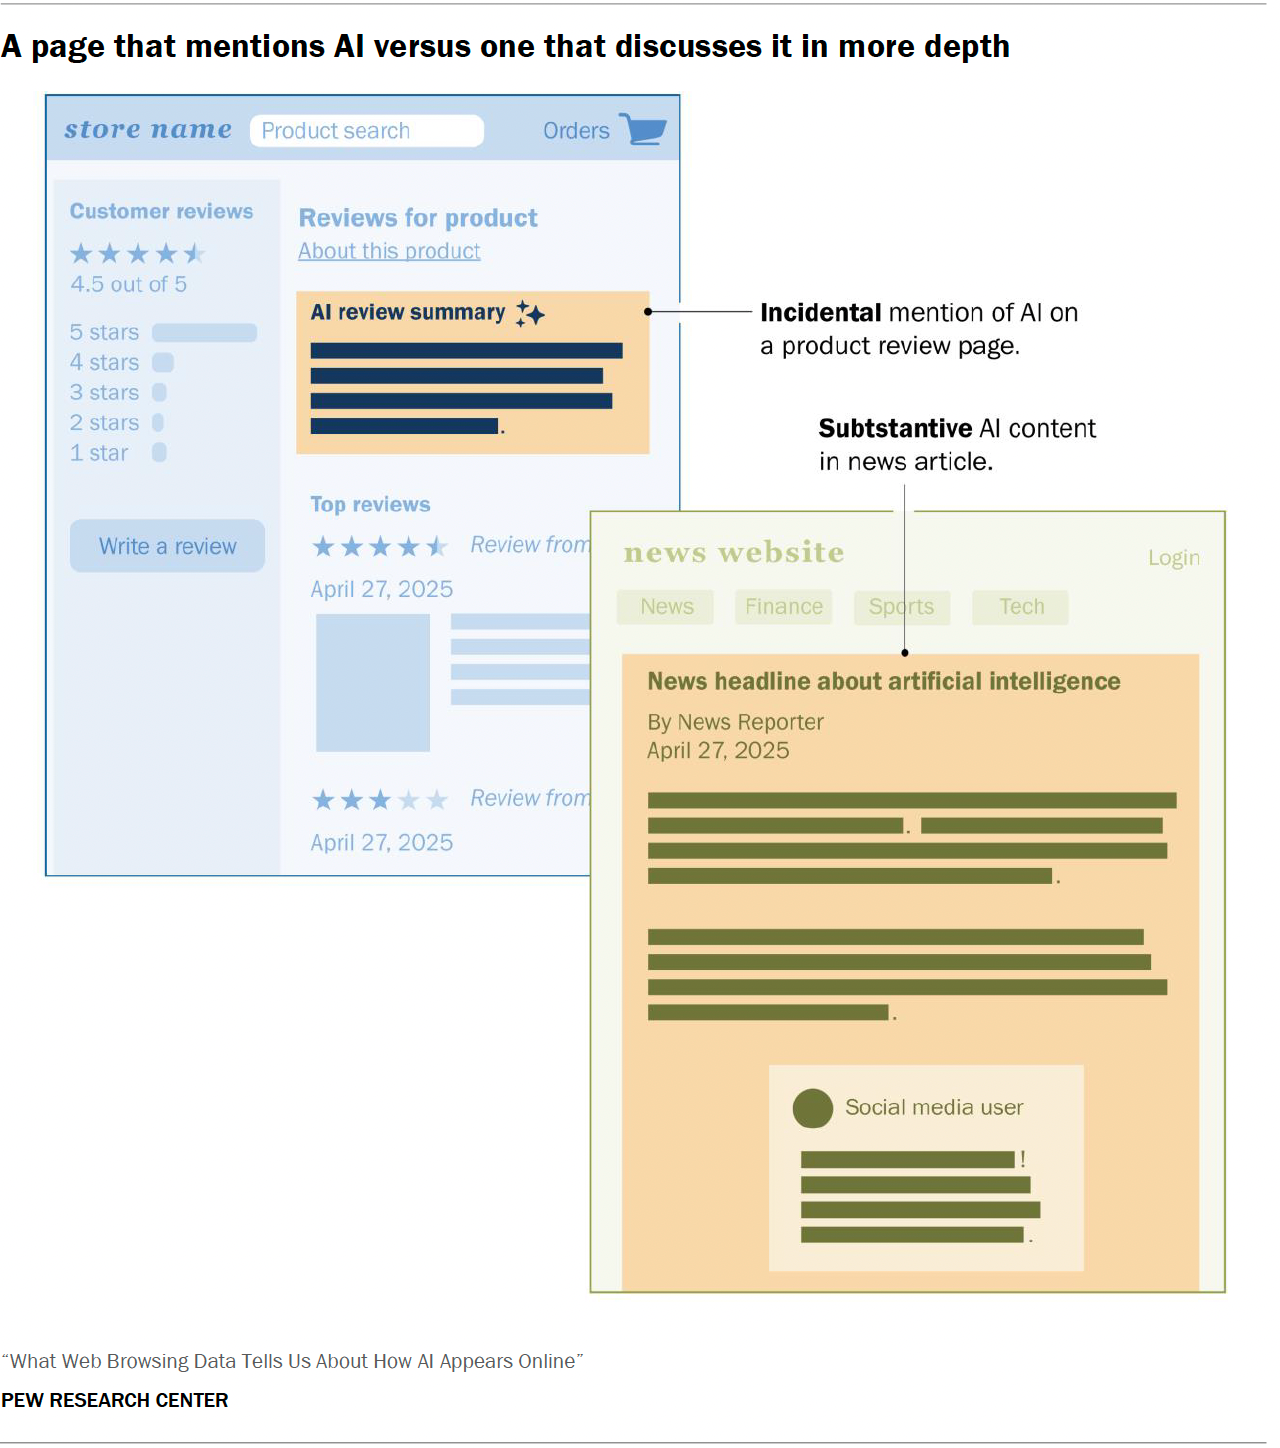
Pew Research Center conducted the 2025 What Web Browsing Data Tells Us About How AI Appears Online.
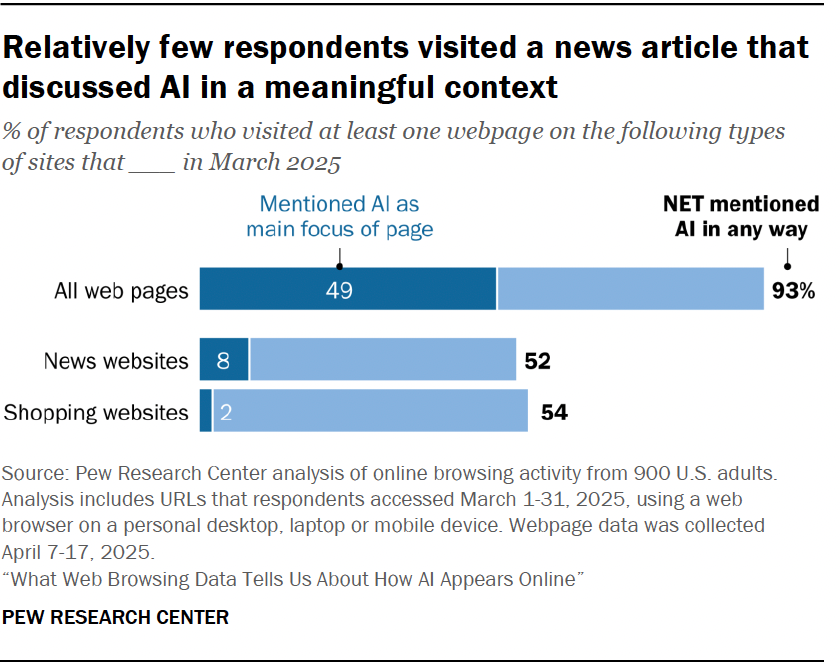
Example: AI mentions
Researchers used logistic regression to classify online articles in which AI was a central focus versus an incidental mention.
\[ \log\Big(\frac{\pi}{1-\pi}\Big) = \mathbf{X}\boldsymbol{\beta} \]
What is STA 221?

Prerequisites: Introductory statistics or probability course and linear algebra
Recommended corequisite: Probability course
Computing toolkit

All analyses using R, a statistical programming language
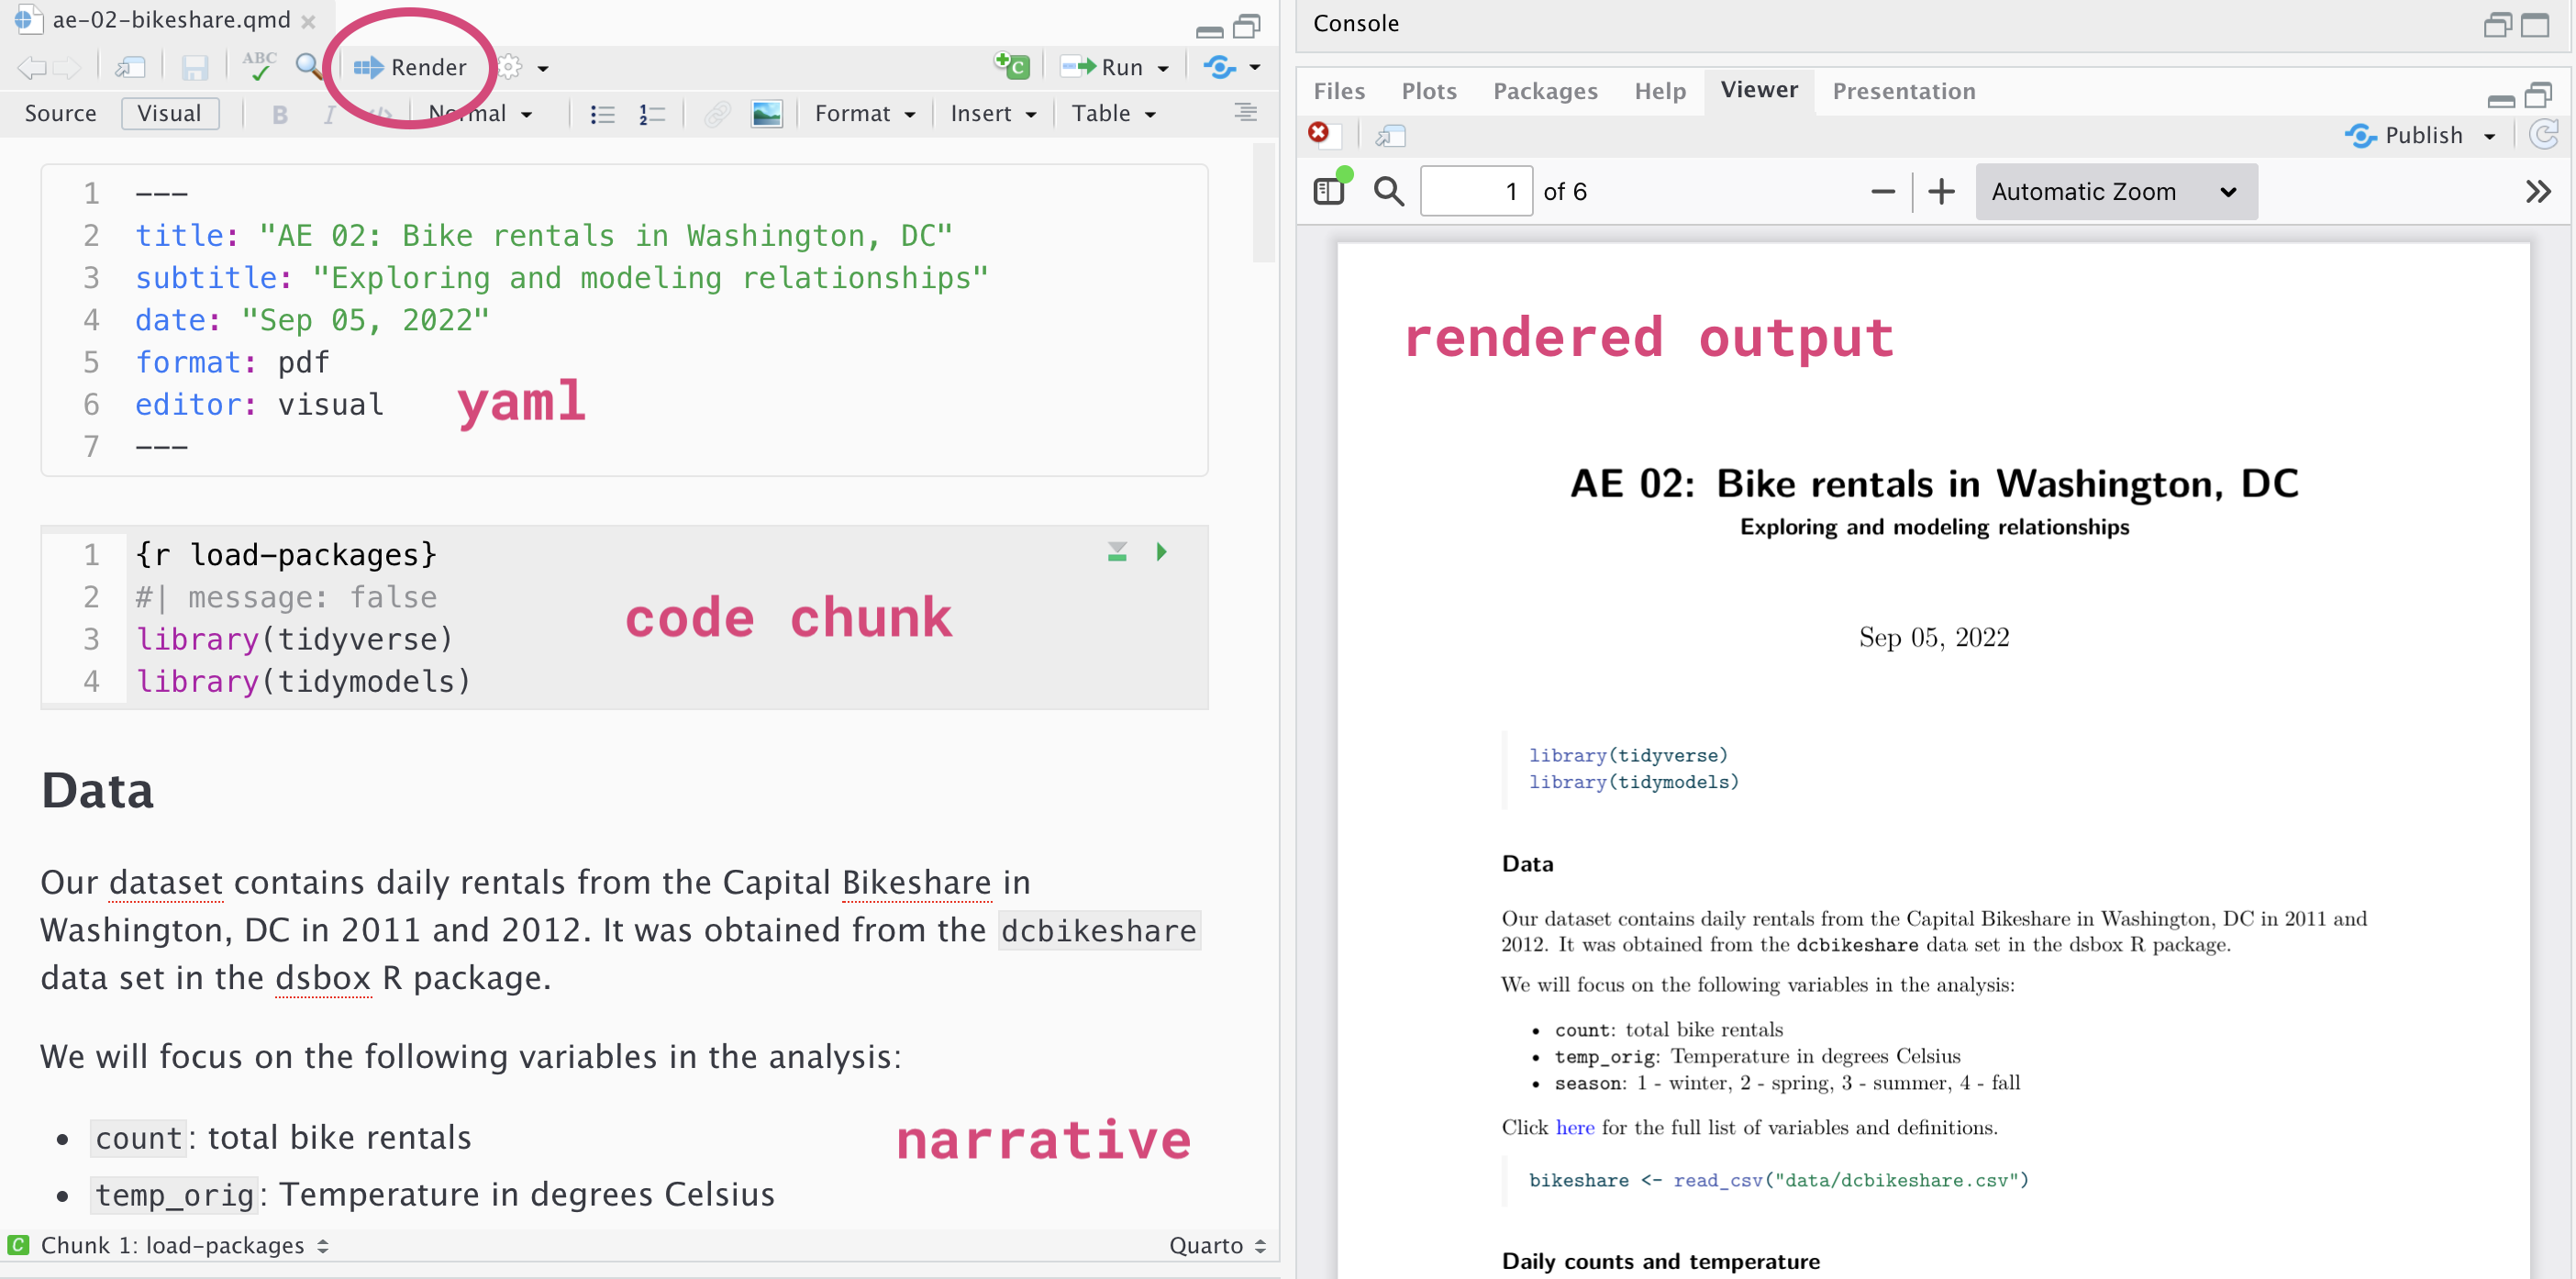
Write reproducible reports in Quarto
Access RStudio through STA 221 Docker Containers

Access assignments
Facilitates version control and collaboration
All work in STA 221 course organization
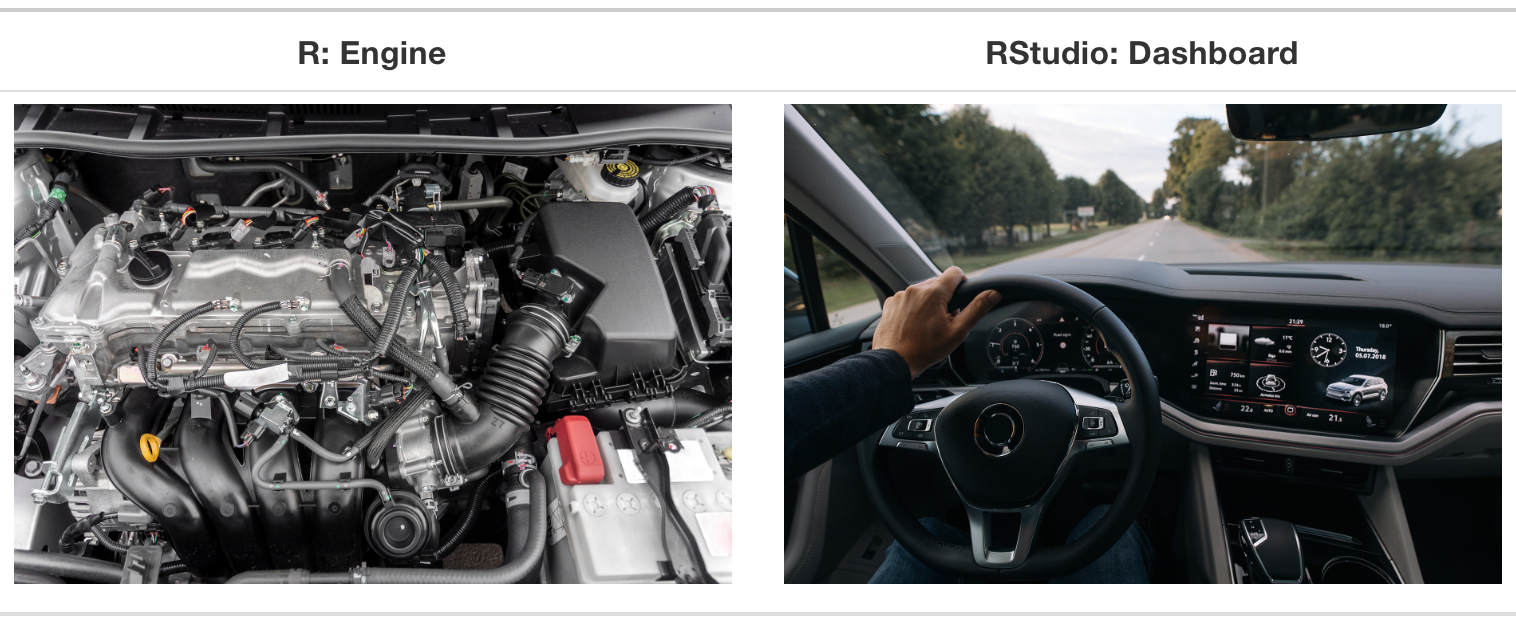
R and RStudio
R is a statistical programming language
RStudio is a convenient interface for R (an integrated development environment, IDE)
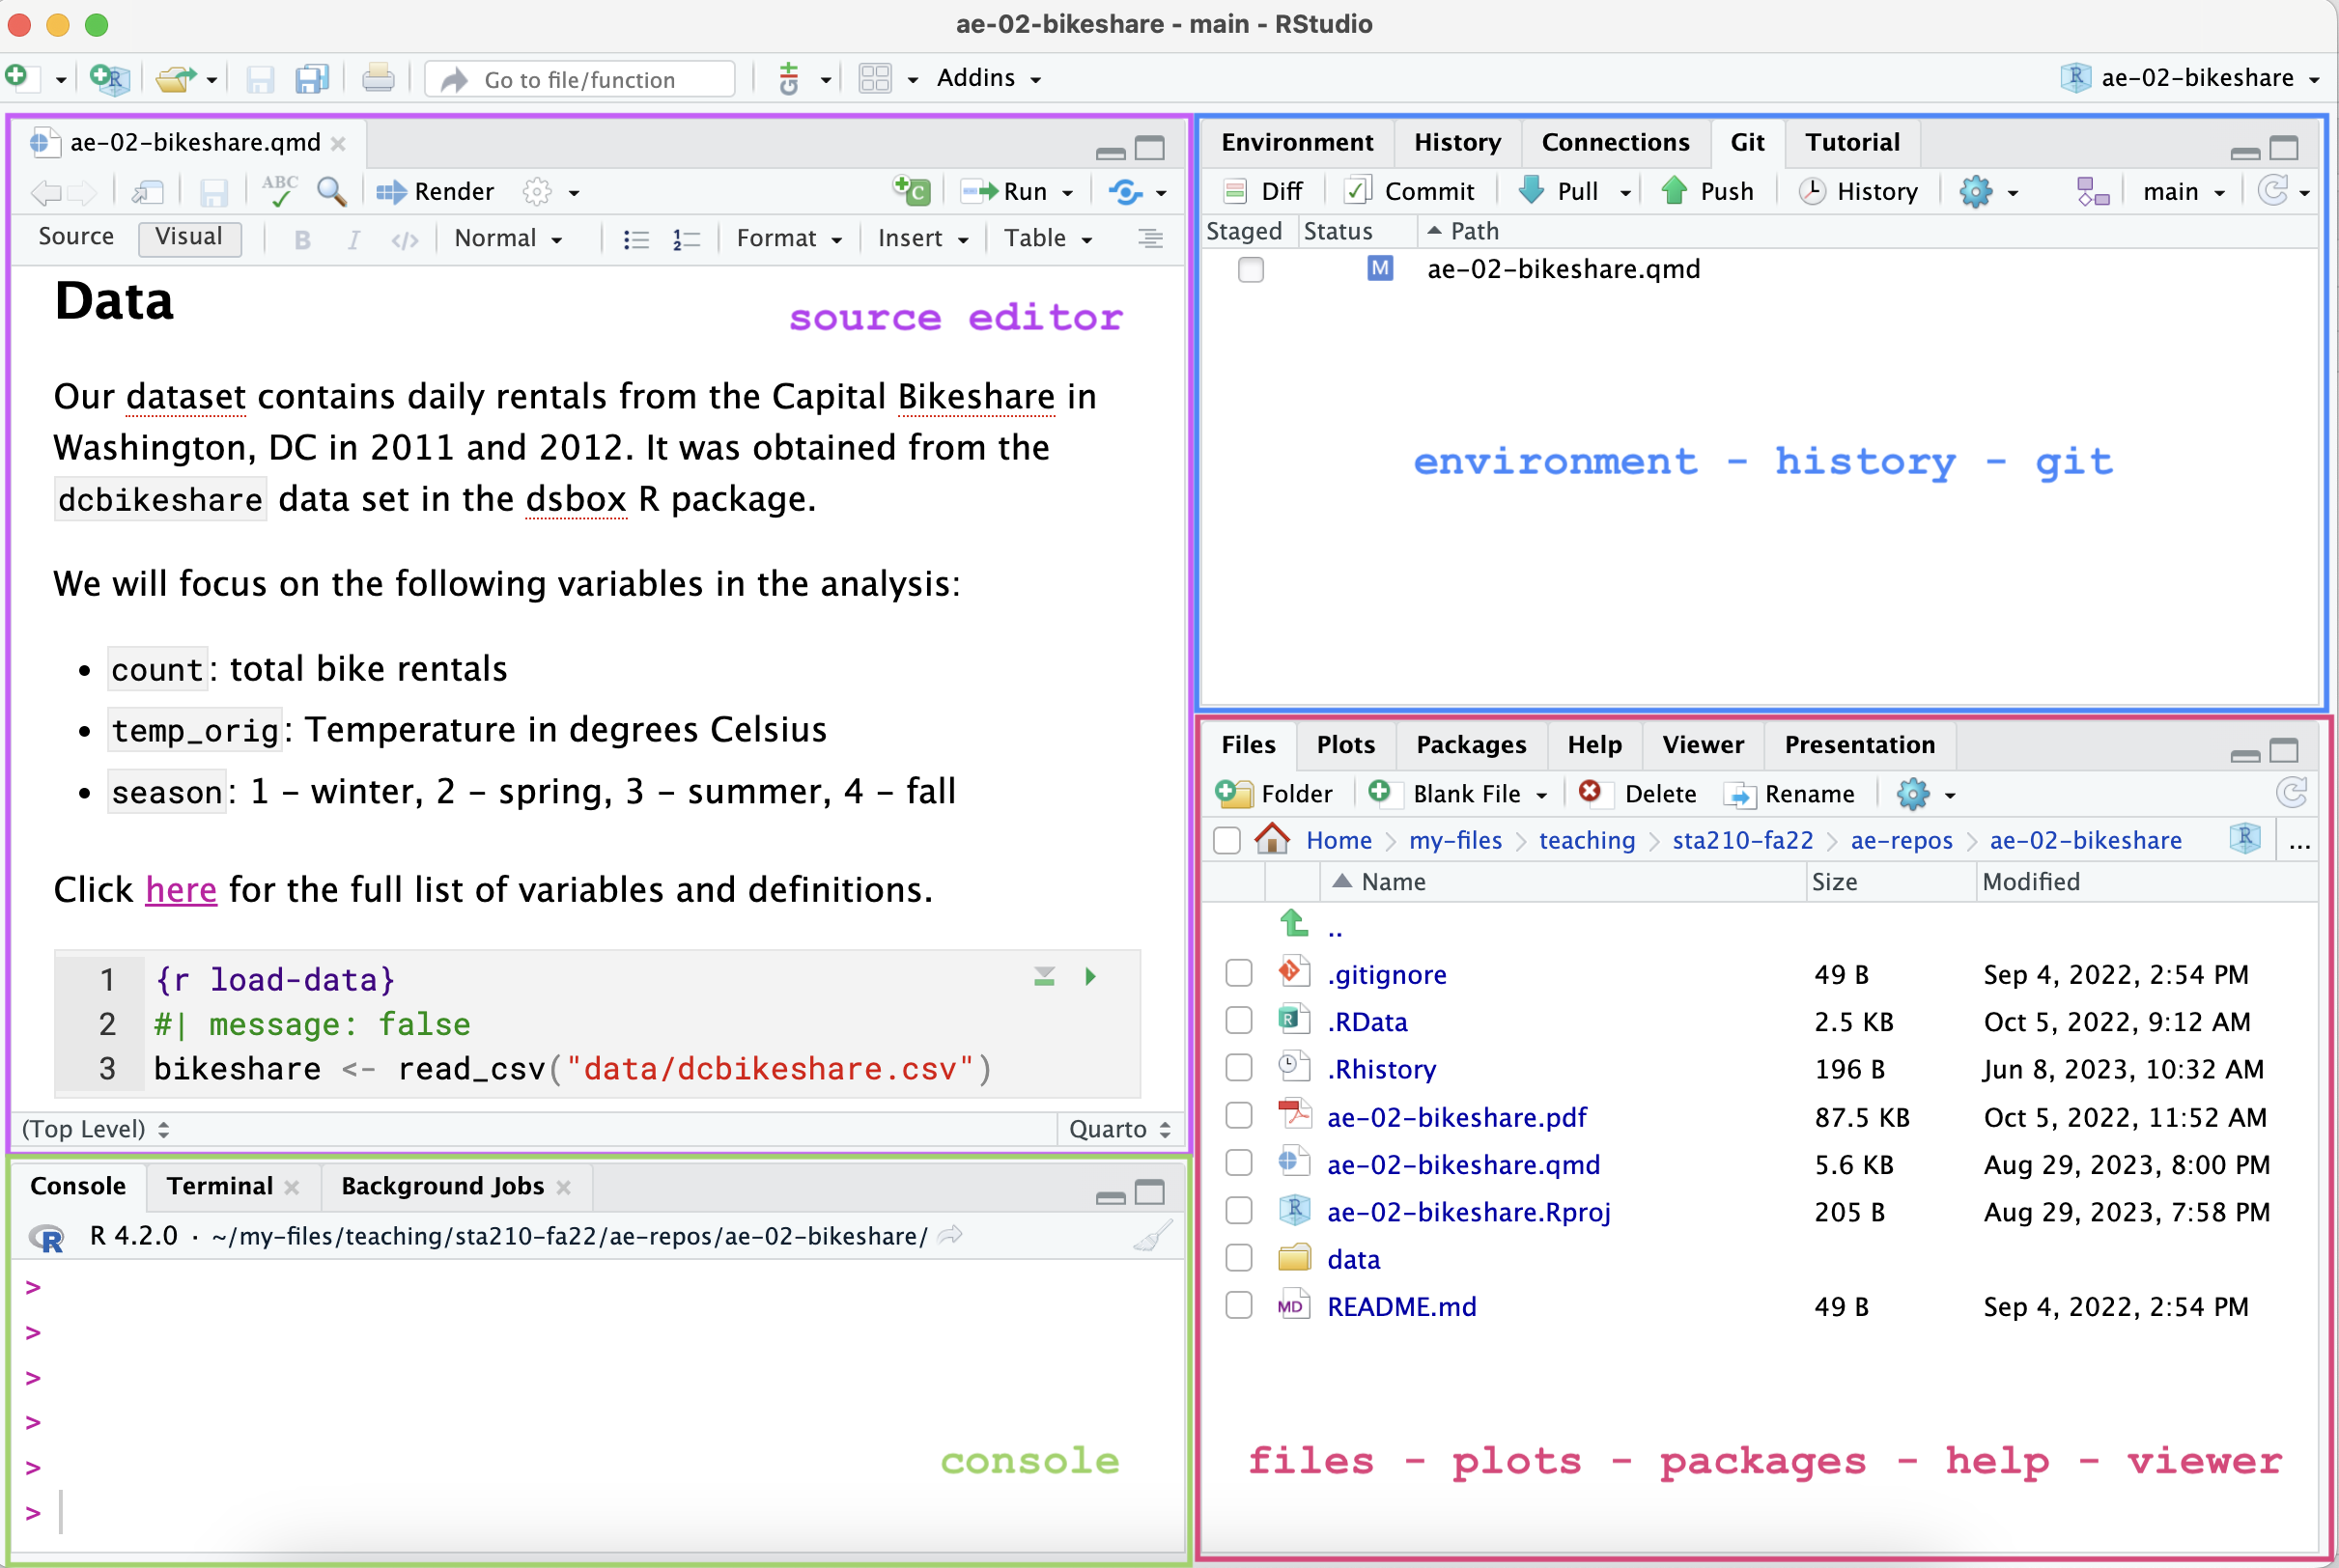
RStudio IDE
Quarto
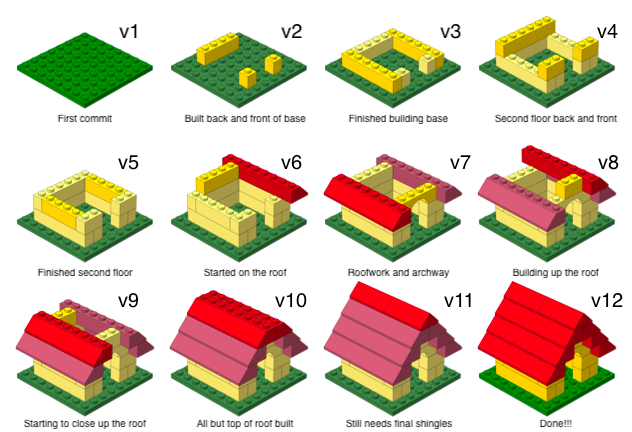
What is versioning?

What is versioning?
with human readable messages
Why do we need version control?
Provides a clear record of how the analysis methods evolved. This makes analysis auditable and thus more trustworthy and reliable. (Ostblom and Timbers 2022)
git and GitHub

- git is a version control system – like “Track Changes” features from Microsoft Word.
- GitHub is the home for your git-based projects on the internet (like DropBox but much better).
- There are a lot of git commands and very few people know them all. 99% of the time you will use git to add, commit, push, and pull.