Welcome to STA 221!
Welcome!
Meet Prof. Tackett!
- Education and career journey
- BS in Math and MS in Statistics from University of Tennessee
- Statistician at Capital One
- PhD in Statistics from University of Virginia
- Associate Professor of the Practice, Department of Statistical Science at Duke
- Work focuses on statistics education and inclusive teaching practices
- Co-leader of the Bass Connections team Mental Health and the Justice System in Durham County
- Mom of 3-year-old twins 🙂 (and one grumpy cat)
Meet the Teaching Assistants (TAs)!
Cathy Lee (PhD): Lab 01 leader
Krish Bansal (UG): Lab 01 helper
Xueyan Hu (MS): Lab 02 leader
Allison Yang (UG): Lab 02 helper
Topics
Introduction to the course
Syllabus activity
Reproducibility
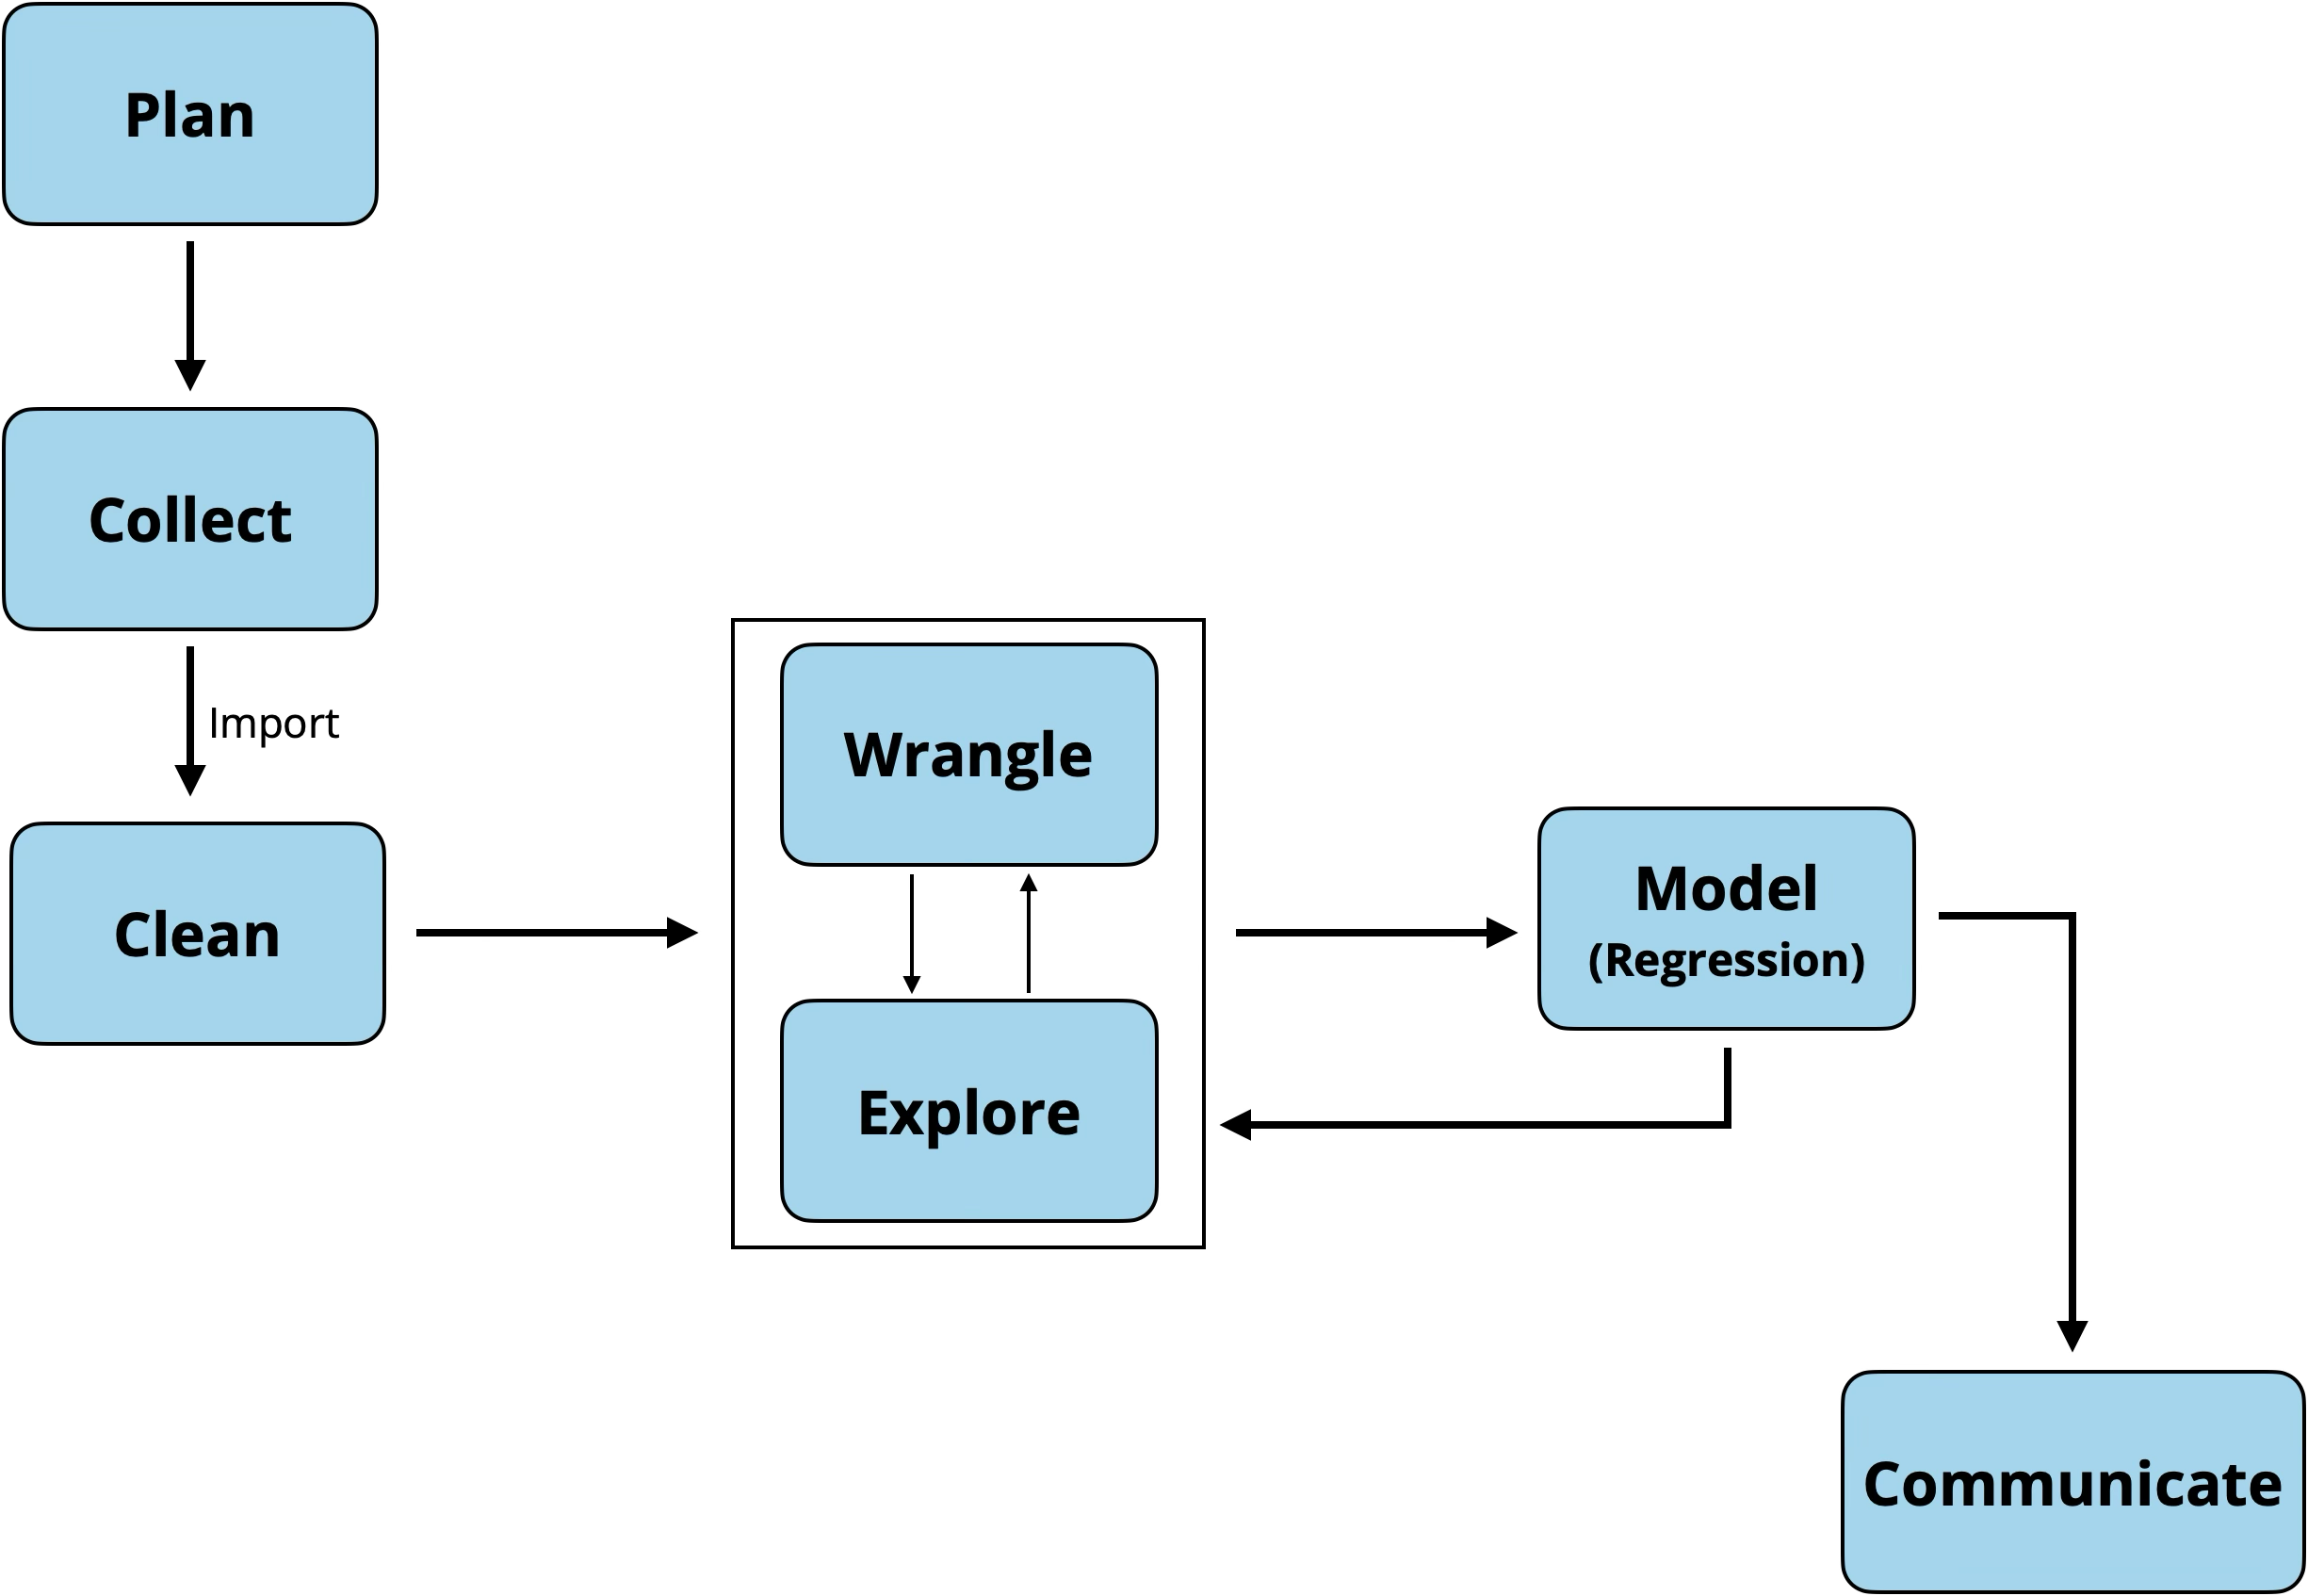
Introduction to STA 221
Data science workflow
What is regression analysis?
In statistical modeling, regression analysis is a statistical method for estimating the relationship between a dependent variable (often called the outcome or response variable, or a label in machine learning parlance) and one or more independent variables (often called regressors, predictors, covariates, explanatory variables or features).[1][2]
Source: Wikipedia (January 2026)
Linear regression in practice
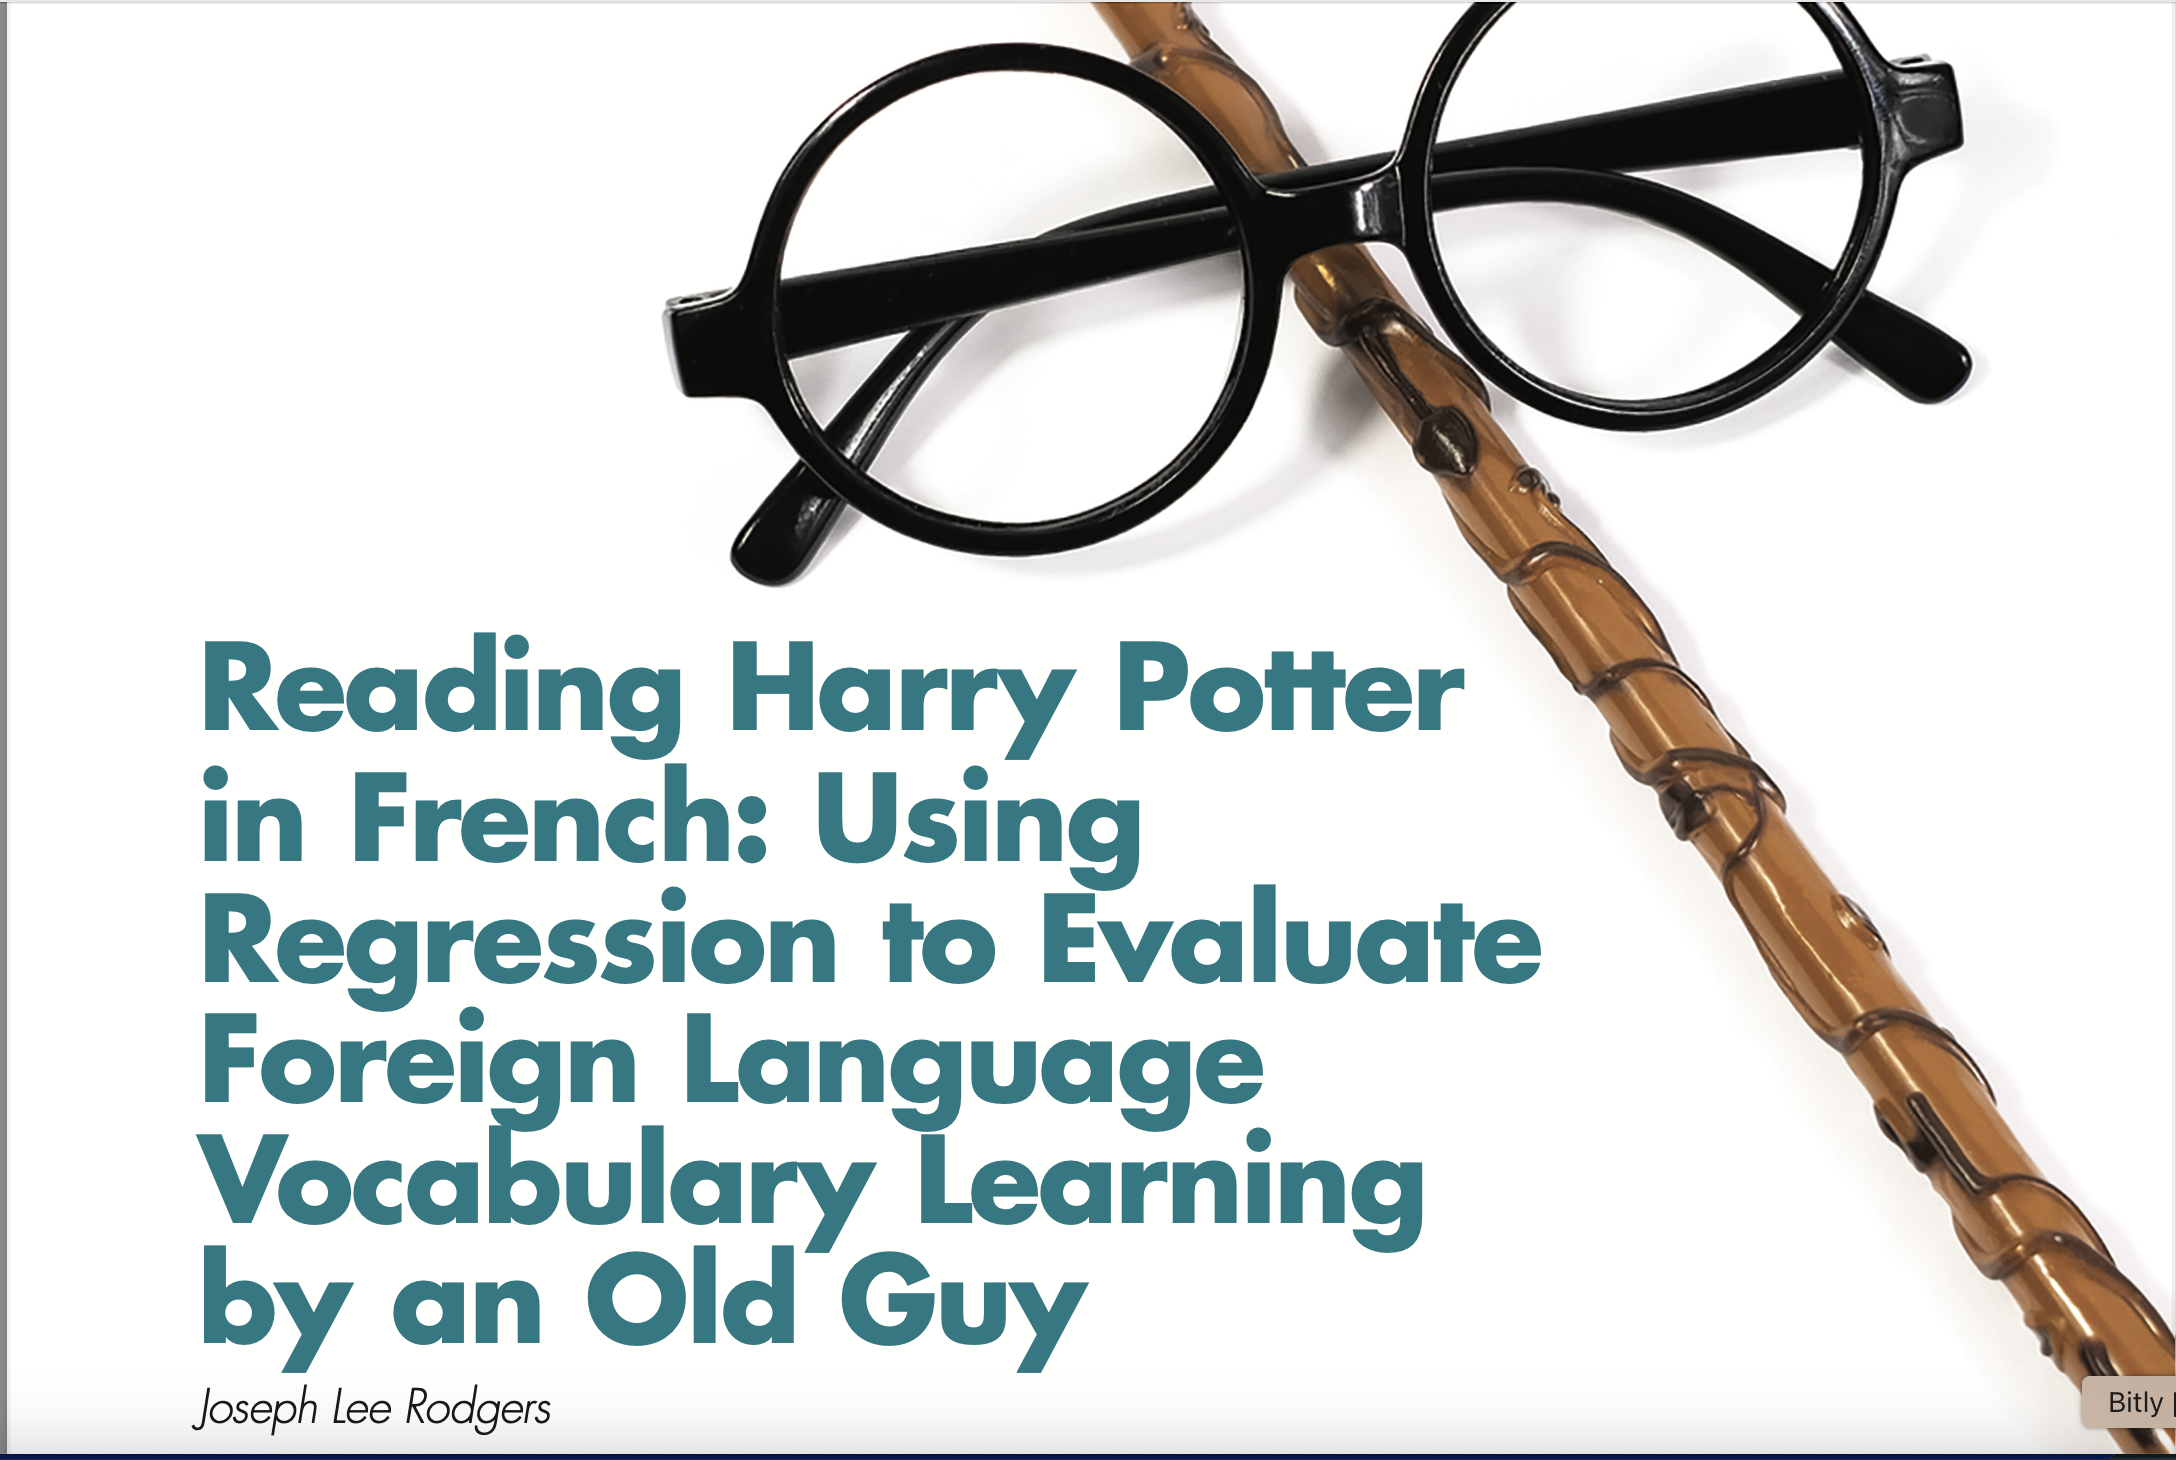
Example: Reading Harry Potter
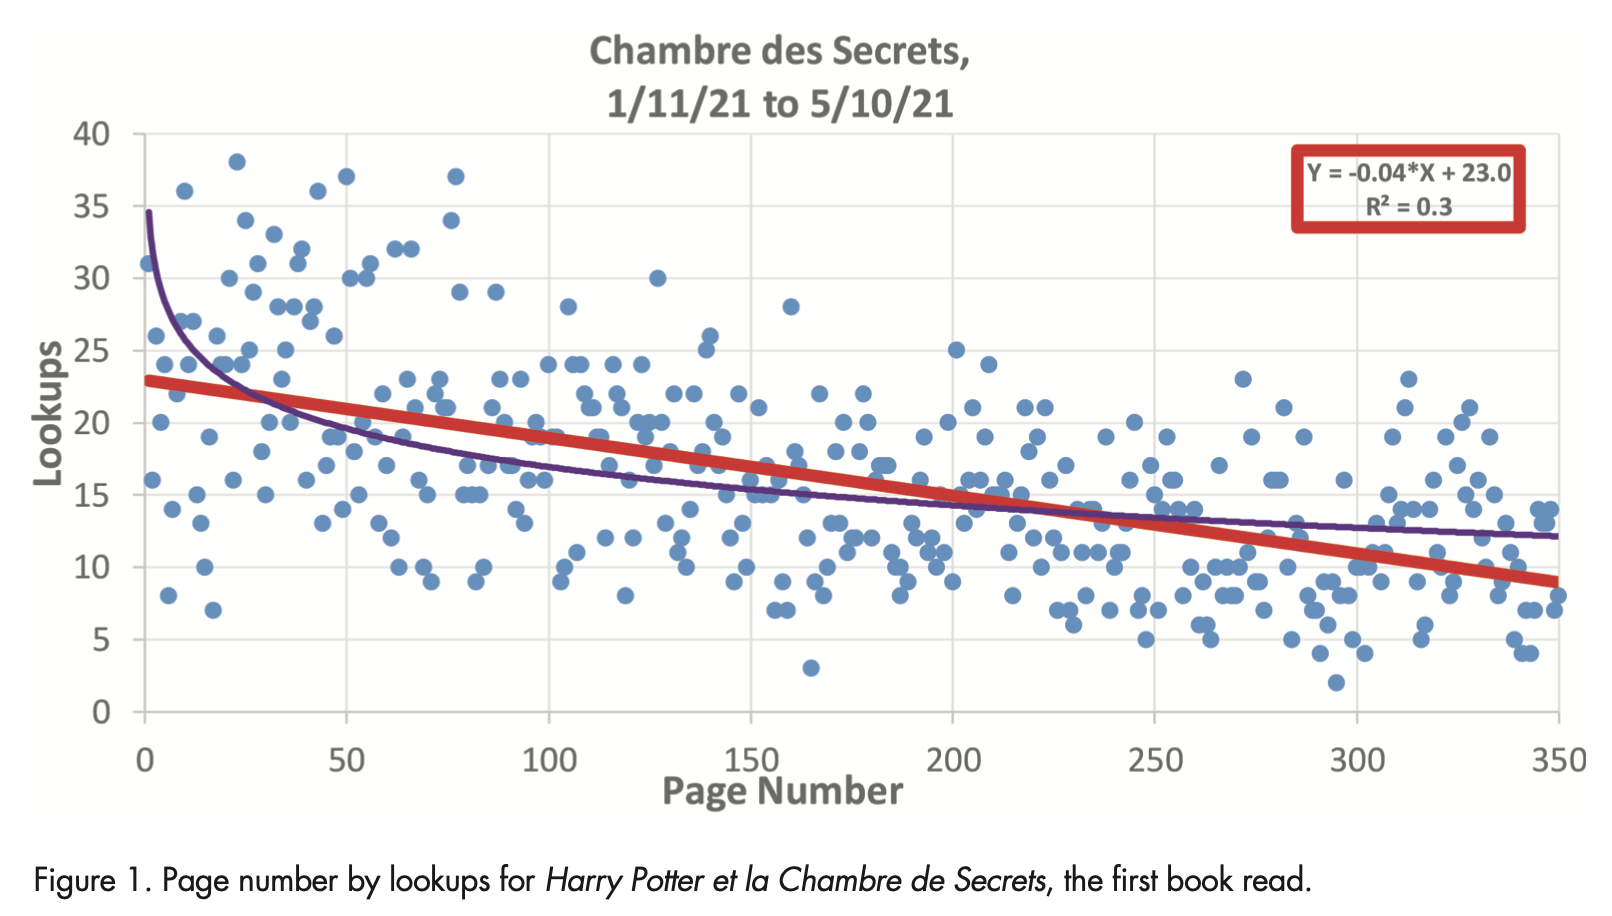
\[ \text{Lookups} = 23.0 - 0.04 \times \text{Page Number} \]
Example: Reading Harry Potter
\[ \text{Lookups} = \beta_0 + \beta_1 ~ \text{Page Number} + \epsilon \]
. . .
\[ \begin{bmatrix} y_1 \\ y_2 \\ \vdots \\ y_n \end{bmatrix} = \begin{bmatrix} 1 & x_1 \\ 1 & x_2 \\ \vdots & \vdots \\ 1 & x_n \end{bmatrix} \begin{bmatrix} \beta_0 \\ \beta_1 \\ \end{bmatrix} + \begin{bmatrix} \epsilon_1 \\ \epsilon_2 \\ \vdots \\ \epsilon_n \end{bmatrix} \]
Logistic regression in practice
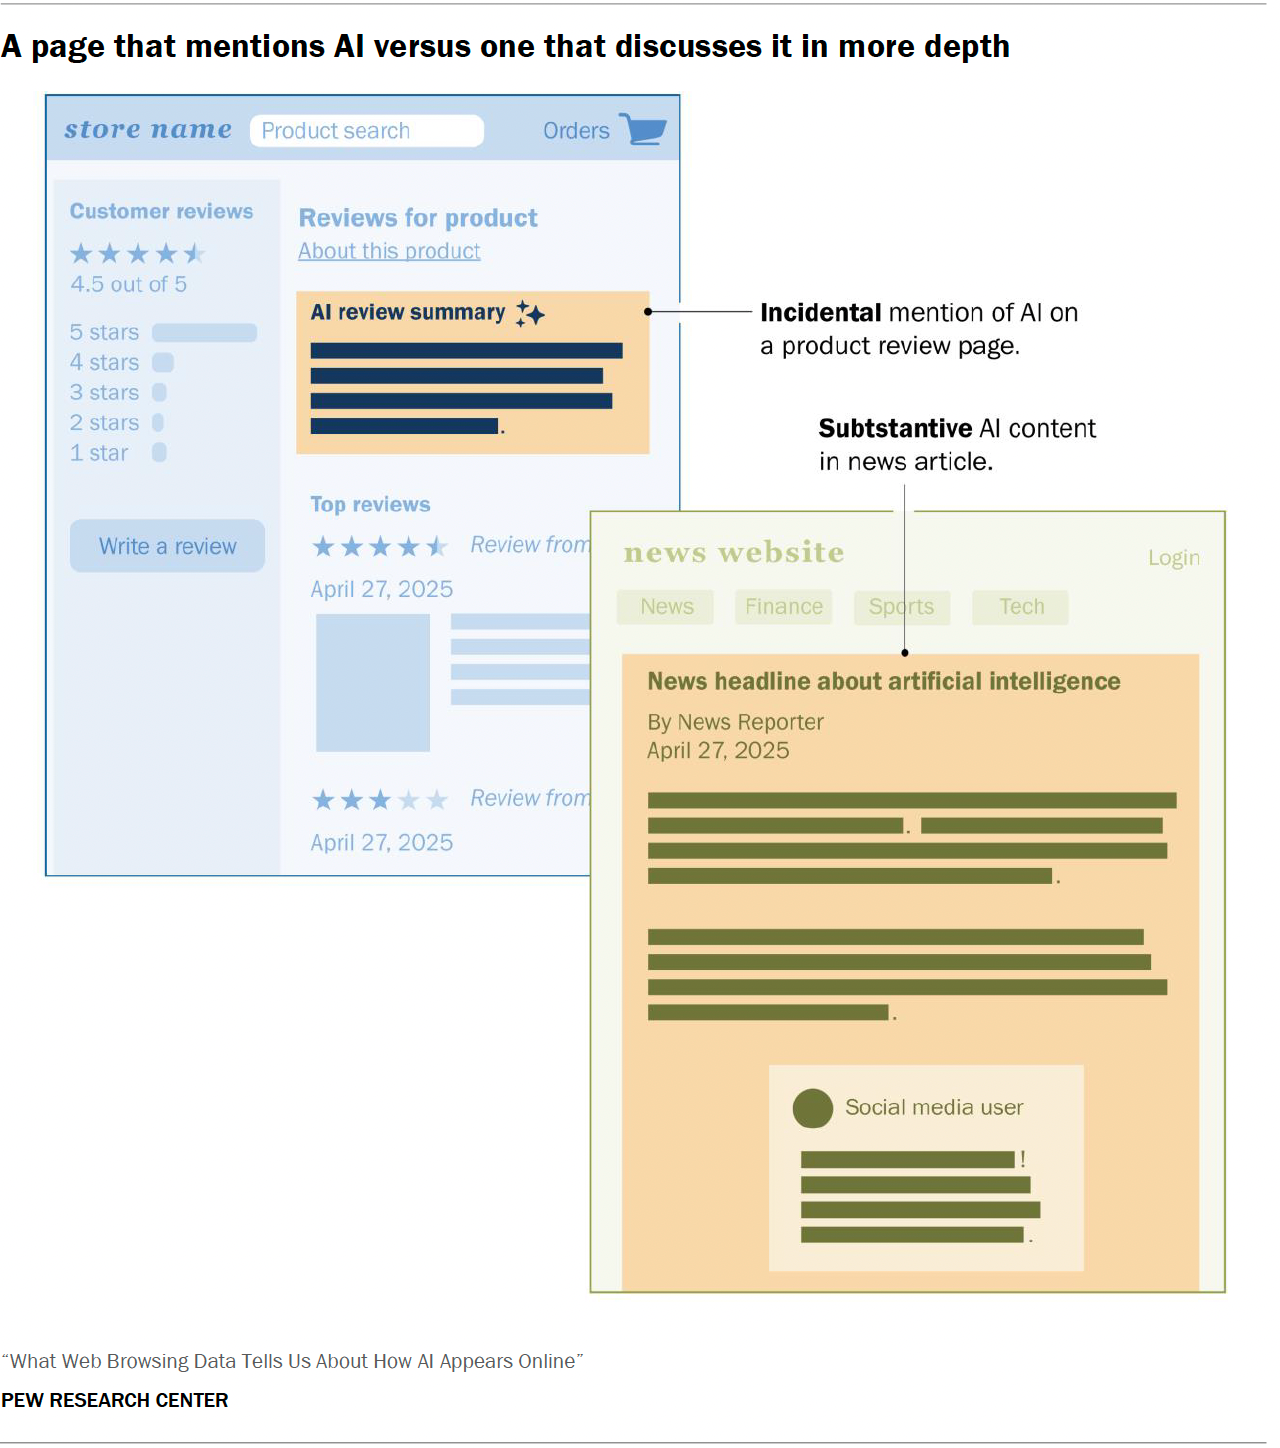
Pew Research Center conducted the 2025 What Web Browsing Data Tells Us About How AI Appears Online.
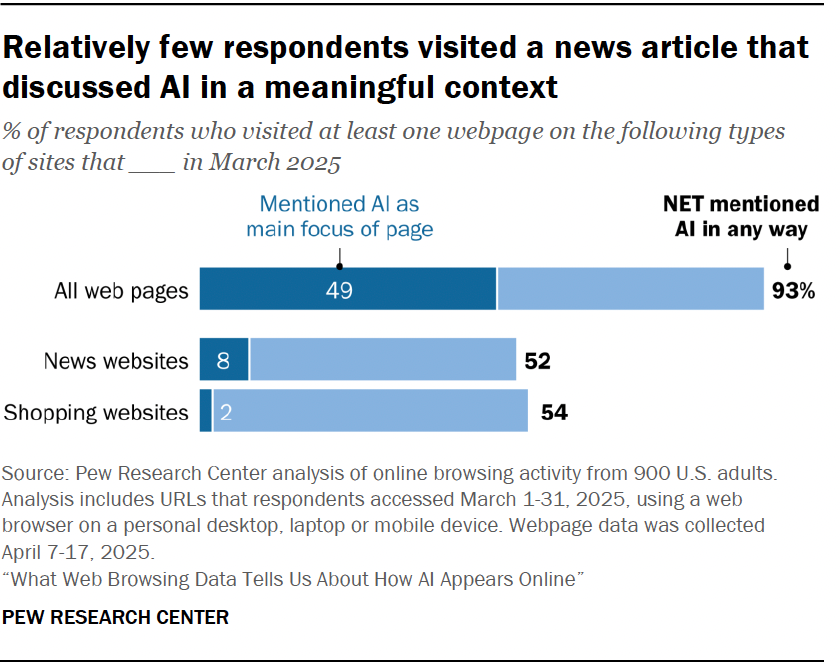
Example: AI mentions
Researchers used logistic regression to classify online articles in which AI was a central focus versus an incidental mention.
\[ \log\Big(\frac{\pi}{1-\pi}\Big) = \mathbf{X}\boldsymbol{\beta} \]
STA 221
What is STA 221?
Prerequisites: Introductory statistics or probability course and linear algebra
Recommended corequisite: Probability course
Course learning objectives
By the end of the semester, you will be able to…
- analyze data to explore real-world multivariable relationships.
- fit, interpret, and draw conclusions from linear and logistic regression models.
- implement a reproducible analysis workflow using R for analysis, Quarto to write reports and GitHub for version control and collaboration.
- explain the mathematical foundations of linear and logistic regression.
- effectively communicate statistical results to a general audience.
- assess the ethical considerations and implications of analysis decisions.
Course topics
Linear regression
- Coefficient estimation and interpretation
- Prediction
- Model evaluation
- Matrix representation of regression
- Model conditions and diagnostics
- Model selection
- Types of predictors
- Properties of estimators
Logistic regression
- Coefficient estimation and interpretation
- Prediction
- Model evaluation
- Inference
Special topics
General topics
- Computing using R and GitHub
- Presenting statistical results
- Collaboration and teamwork
- Ethics
Course overview
Course toolkit
- Website: https://sta221-sp26.github.io
- Central hub for the course!
- Tour of the website
- Canvas: https://canvas.duke.edu/courses/73984
- Gradebook
- Office hours
- Announcements
- Gradescope
- Ed Discussion
- GitHub: https://github.com/sta221-sp26
- Distribute assignments
- Platform for version control and collaboration
Computing toolkit

All analyses using R, a statistical programming language
Write reproducible reports in Quarto
Access RStudio through STA 221 Docker Containers

Access assignments
Facilitates version control and collaboration
All work in STA 221 course organization
Classroom community
It is my intent that students from all diverse backgrounds and perspectives be well-served by this course, that students’ learning needs be addressed both in and out of class, and that the diversity that the students bring to this class be viewed as a resource, strength and benefit.
If you have a name that differs from those that appear in your official Duke records, please let me know.
Please let me know your preferred pronouns, if you are comfortable sharing.
If you feel like your performance in the class is being impacted by your experiences outside of class, please don’t hesitate to come and talk with me. If you prefer to speak with someone outside of the course, your advisers and deans are excellent resources.
I (like many people) am still in the process of learning about diverse perspectives and identities. If something was said or done in class (by anyone) that made you feel uncomfortable, please talk to me about it.
Accessibility
The Student Disability Access Office (SDAO) is available to ensure that students are able to engage with their courses and related assignments.
If you have documented accommodations from SDAO, please send the documentation as soon as possible.
I am committed to making all course activities and materials accessible. If any course component is not accessible to you in any way, please don’t hesitate to let me know.
Syllabus activity
- Introduce yourselves.
- Read the portion of the syllabus assigned to your group.
- Discuss the key points and questions you my have with your neighbors.
- We’ll ask for volunteers to share a summary with the class.
Syllabus activity assignments
Groups 1 & 2: What to expect in lectures and labs
Groups 3 & 4: Teams
Groups 7 & 8: Exams and final project
Groups 9 & 10: Academic honesty
Groups 11 & 12: Late work policy and waiver for extenuating circumstances
Groups 13 & 14: Attendance and lecture recording request
Syllabus activity report out
Groups 1 & 2: What to expect in lectures and labs
Groups 3 & 4: Teams
Groups 7 & 8: Exams and final project
Groups 9 & 10: Academic honesty
Groups 11 & 12: Late work policy and waiver for extenuating circumstances
Groups 13 & 14: Attendance and lecture recording request
Grading
| Category | Percentage |
|---|---|
| Homework | 15% |
| Labs | 10% |
| Exam 01 | 20% |
| Exam 02 | 20% |
| Final Exam | 20% |
| Final project | 15% |
Five tips for success in STA 221
Complete all prepare readings and tasks before class.
Actively participate and engage in lectures and labs.
Ask questions frequently during lecture, in office hours, on Ed Discussion, and among your classmates.
Complete all homework and labs, asking yourself “why” questions as you go through the steps to complete each exercise.
Stay current with the course material, as each new concept builds on previous ones.
Questions?
Toolkit for a reproducible workflow
Reproducibility checklist
What does it mean for an analysis to be reproducible?
. . .
Near term goals:
✔️ Can the tables and figures be exactly reproduced from the code and data?
✔️ Does the code actually do what you think it does?
✔️ In addition to what was done, is it clear why it was done?
. . .
Long term goals:
✔️ Can the code be used for other data?
✔️ Can you extend the code to do other things?
Why is reproducibility important?
Results produced are more reliable and trustworthy (Ostblom and Timbers 2022)
Facilitates more effective collaboration (Ostblom and Timbers 2022)
Contributing to science, which builds and organizes knowledge in terms of testable hypotheses (Alexander 2023)
Possible to identify and correct errors or biases in the analysis process (Alexander 2023)
Toolkit
Scriptability \(\rightarrow\) R
Literate programming (code, narrative, output in one place) \(\rightarrow\) Quarto
Version control \(\rightarrow\) Git / GitHub
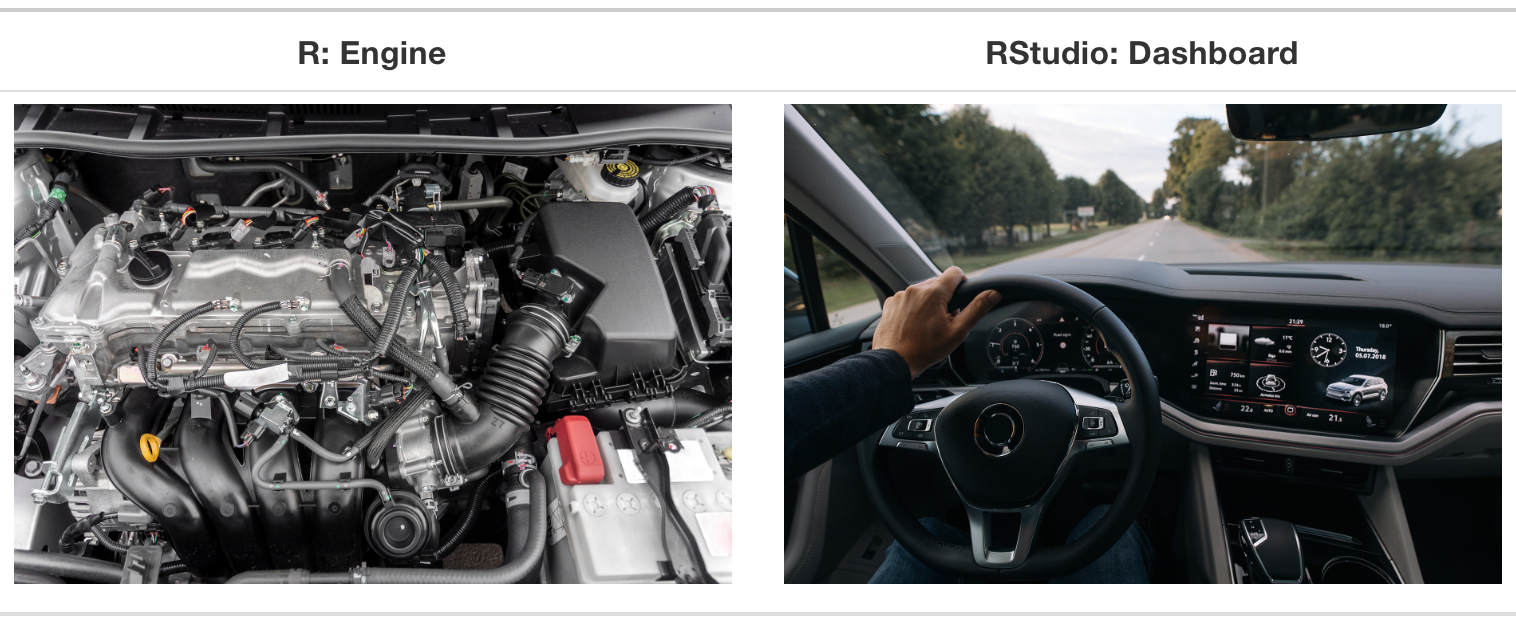
R and RStudio
R is a statistical programming language
RStudio is a convenient interface for R (an integrated development environment, IDE)
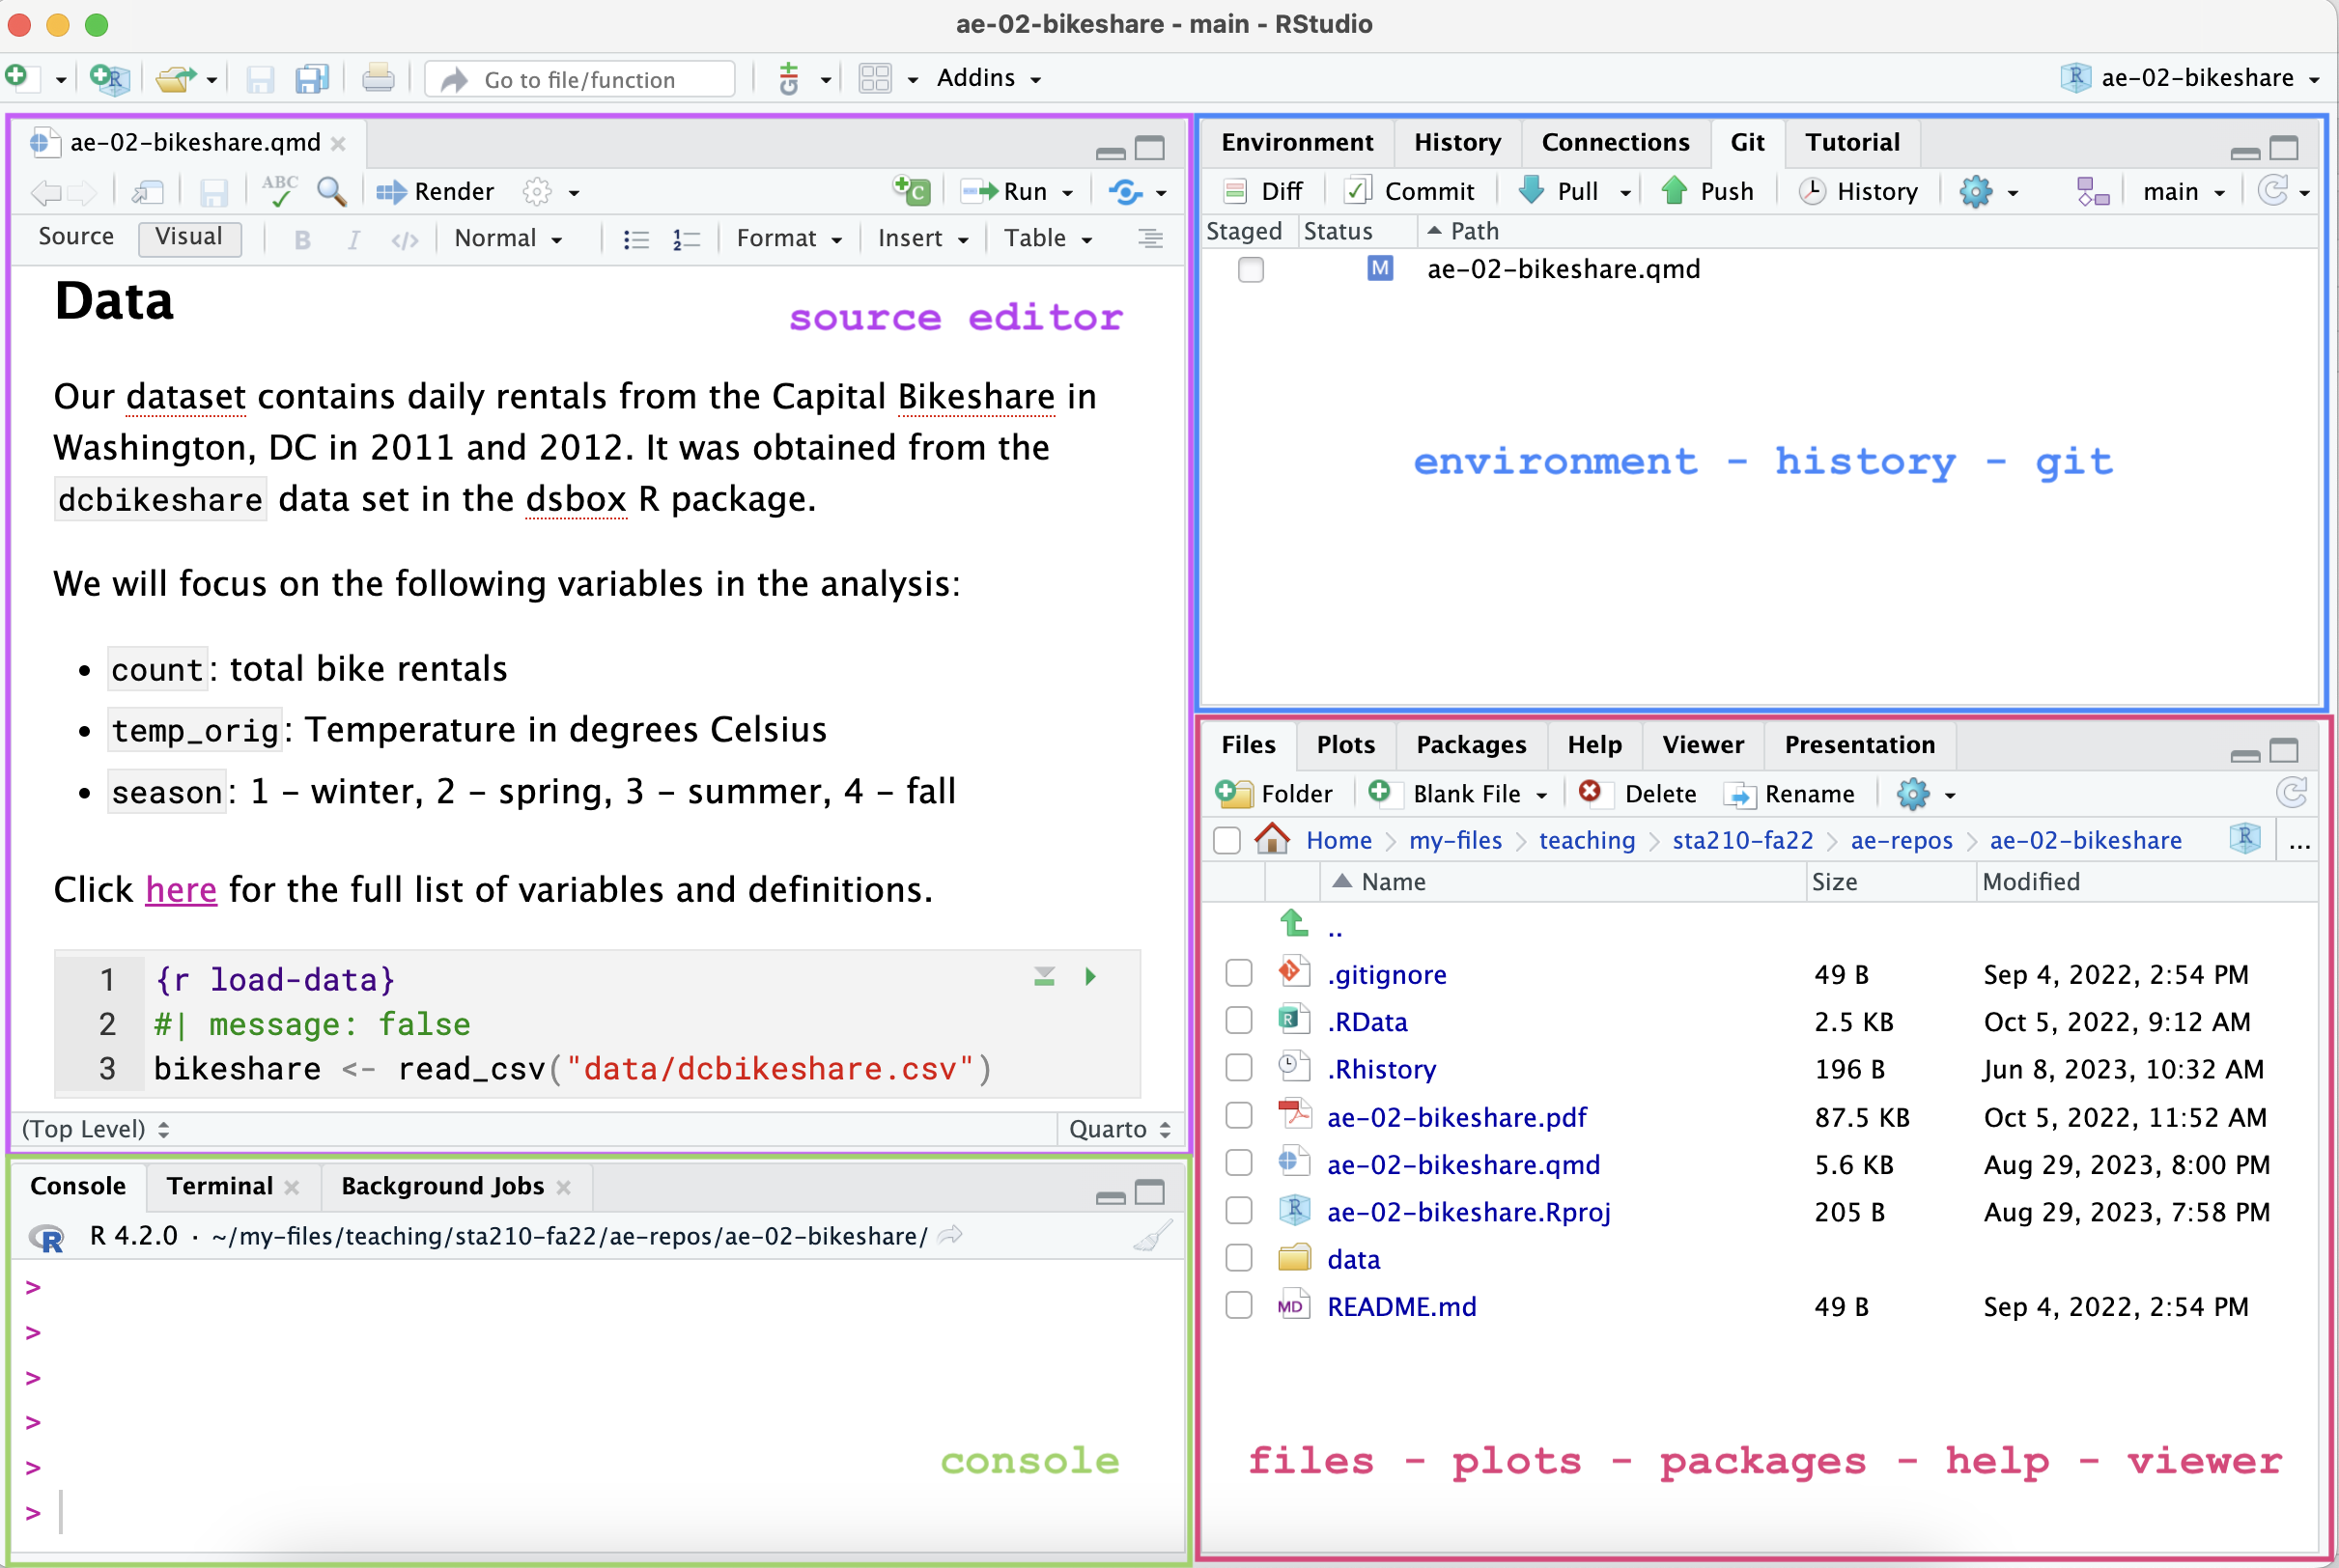
RStudio IDE
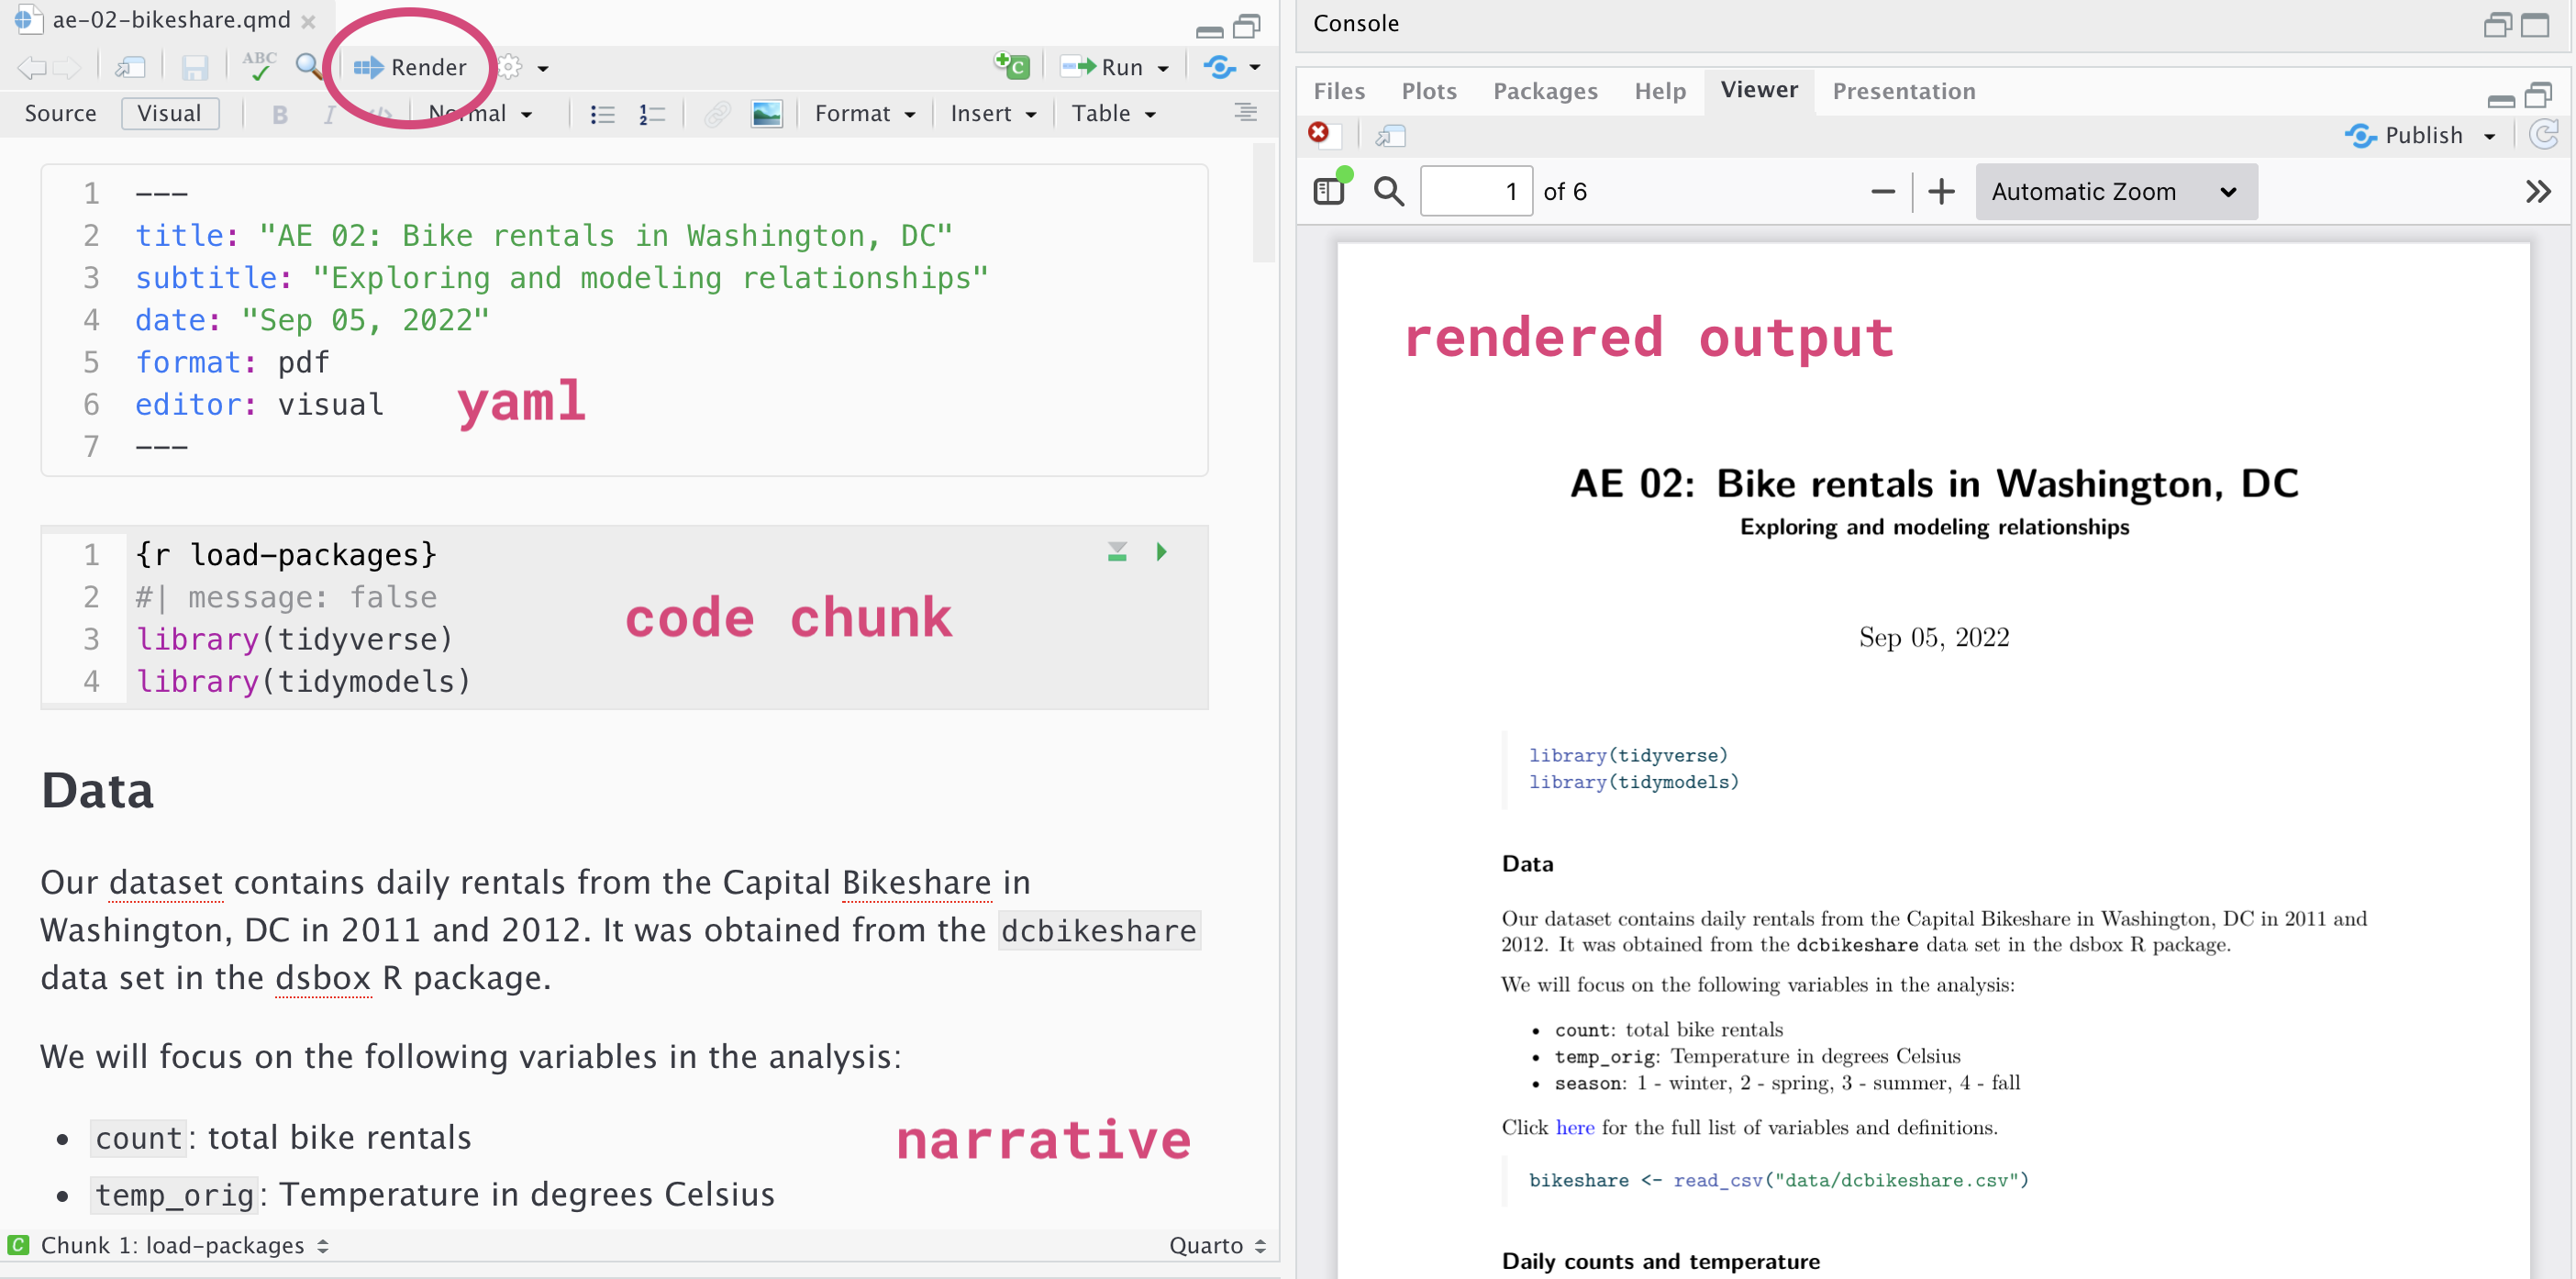
Quarto
Fully reproducible reports – the analysis is run from the beginning each time you render
Code goes in chunks and narrative goes outside of chunks
Visual editor to make document editing experience similar to a word processor (Google docs, Word, Pages, etc.)
Quarto
How will we use Quarto?
Every application exercise and assignment is written in a Quarto document
You’ll have a template Quarto document to start with
The amount of scaffolding in the template will decrease over the semester
Version control with git and GitHub
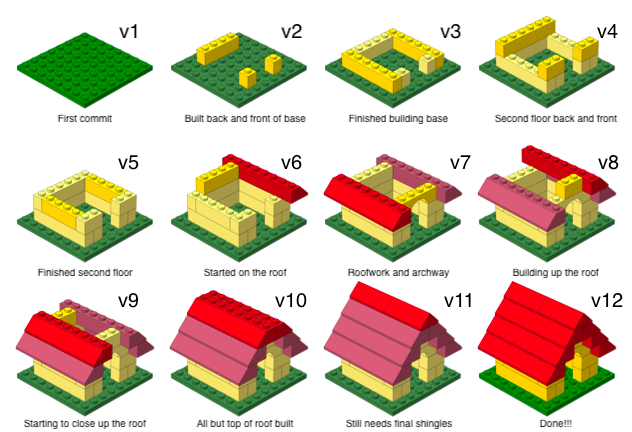
What is versioning?

What is versioning?
with human readable messages
Why do we need version control?
Provides a clear record of how the analysis methods evolved. This makes analysis auditable and thus more trustworthy and reliable. (Ostblom and Timbers 2022)
git and GitHub
- git is a version control system – like “Track Changes” features from Microsoft Word.
- GitHub is the home for your git-based projects on the internet (like DropBox but much better).
- There are a lot of git commands and very few people know them all. 99% of the time you will use git to add, commit, push, and pull.
Before next class
Complete Lecture 02 Prepare
Review syllabus
Labs start tomorrow, January 9
Office hours start Monday, January 12